
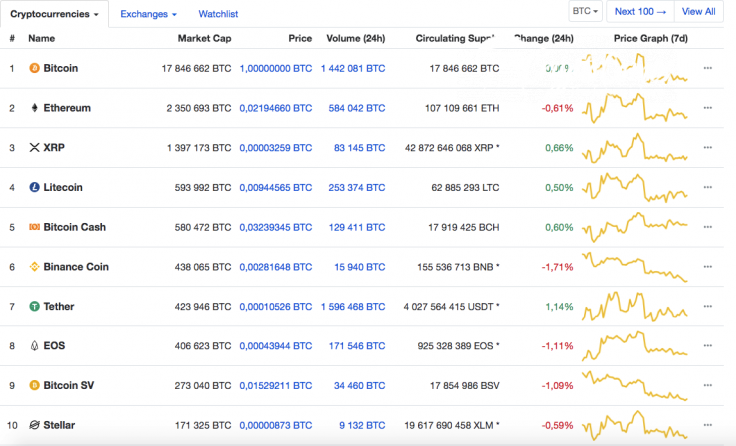
July 30, the cryptocurrency market keeps declining, rolling back coins to their previous level. The rates of the top 10 CMC are going down against the US Dollar. Binance Coin has lost almost 3% of its price compared to its yesterday rate.
However, the situation is much positive in correlation to Bitcoin. XRP is showing the biggest growth, having increased by 0.66% over the last 24 hours. Litecoin and Bitcoin Cash are also located in the green zone against BTC.
Now, let’s get to charts.
LEO/BTC
LEO stands out from the rest of altcoins, as its rate has gone up by 4.5% over the last day. It is the biggest gainer out of the top 20 coins.
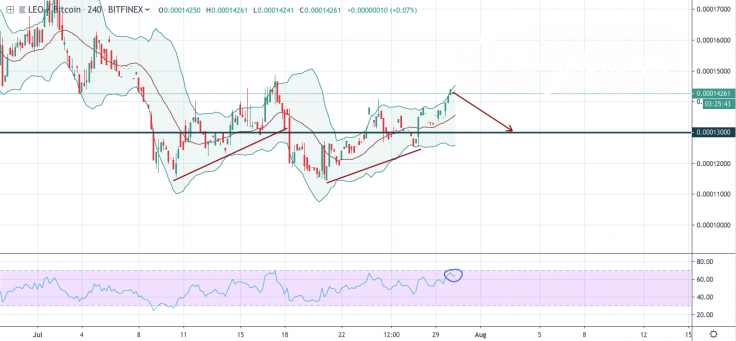
On the 4H chart, LEO has been trading sideways with slight fluctuations up and down since the beginning of July. Regarding the nearest price forecast, LEO is likely to decline to the nearest support zone at 0.00013 BTC. The RSI indicator is locating at the verge of the overbought confirms such a scenario.
The price of LEO is trading at 0.00014261 BTC at the time of writing.
LINK/BTC
If LEO is the top gainer, Chainlink looks like the biggest loser, as its rate has plummeted by more than 6.5%.

LINK has been steadily declining over the last month, and the rate has rolled back to the positions of the end of June.
According to the chart, the current level is not the bottom, and LINK might go below the support at 0.0002 BTC. The low trading volume and decreasing MACD indicator are signals of a further price drop.
The price of LINK is trading at 0.00021312 BTC at the time of writing.
ATOM/BTC
Even though the rate of ATOM has almost not changed since yesterday, the general picture remains bearish.
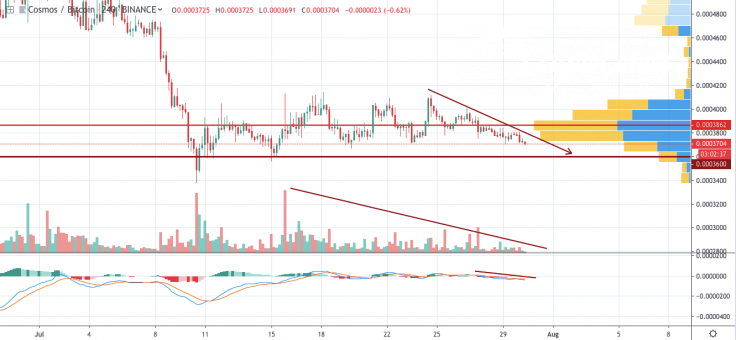
On the 4H chart, the quotes have been located sideways since mid-July. However, the nearest price scenario is bearish, as trading volume has dropped. What is more, the lines of the MACD indicator are moving downward, suggesting the price decline. In this regard, ATOM might rollback to the level of 0.00036 BTC in a few days.
The price of ATOM is trading at 0.0003705 BTC at the time of writing.


