The situation on the cryptocurrency market has improved as some coins from the top 10 list have come back into the green zone. Principally, yesterday's loser Binance Coin (BNB) is now the top gainer, having risen by 2.66%.
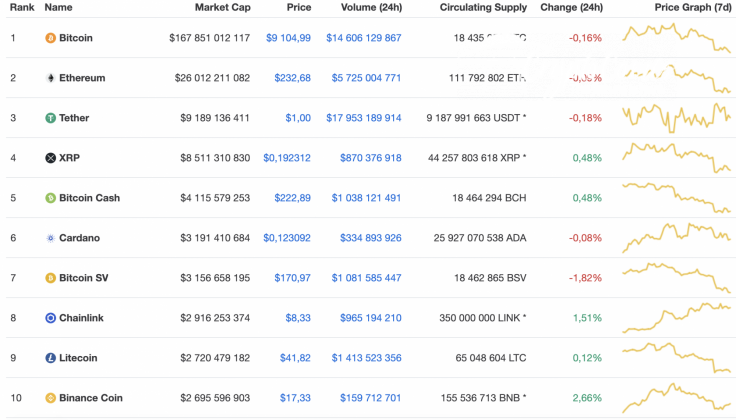
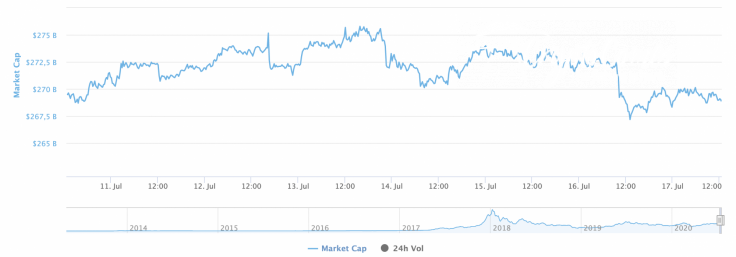
Meanwhile, market capitalization is almost unchanged over the past 7 days and now makes up $269 bln.
Below is the relevant data for BSV as it stands today:
-
Name: Bitcoin SV
-
Ticker: BSV
-
Market Cap: $3,160,524,632
-
Price: $171.18
-
Volume (24h): $1,075,366,891
-
Change (24h): -1.55%
The data is current at press time.
BSV/USD: Can bears break the $170 mark by the end of the week?
Bitcoin SV (BSV) has shown the biggest drop among the top 10 coins. The decline has totaled 1.55% since yesterday, while the price change over the last week has been -5.72%.
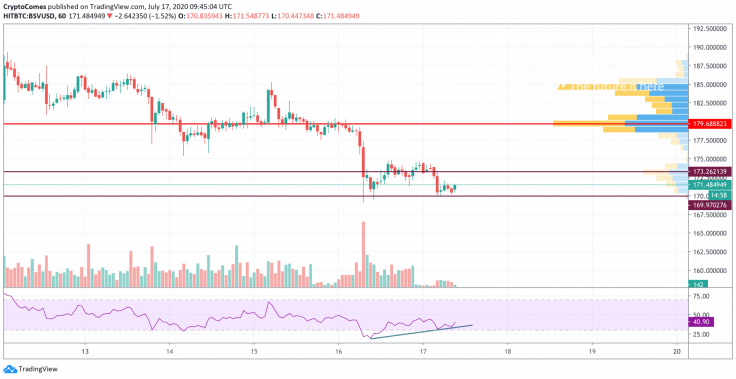
On the hourly chart, Bitcoin SV (BSV) may have found a local support at $170. The decline has not stopped, however. The possibility of a bounce off is supported by the bullish divergence on the RSI indicator. Besides, the trading volume is low, which means that there is little chance of seeing a further decline. A more likely price action is for traders to see a correction to the closest resistance at $173 shortly.
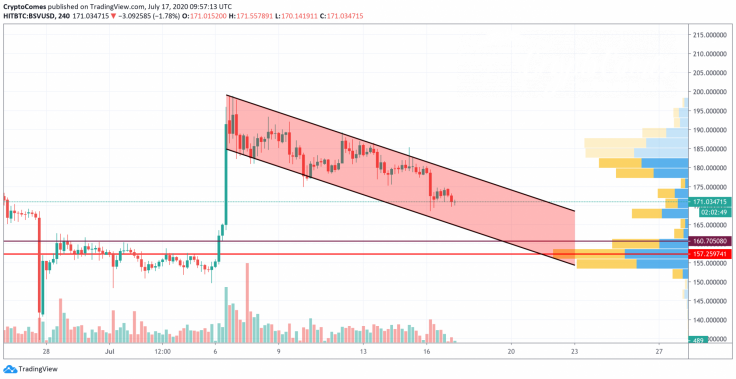
On a longer time frame, the altcoin should not dip to its July 6 mark. At the moment, there are no signals for a trend change due to a lack of trading volume. In this case, the coin might continue its ongoing drop to the bottom of the channel at $160. Sellers may attain this level by the end of July.
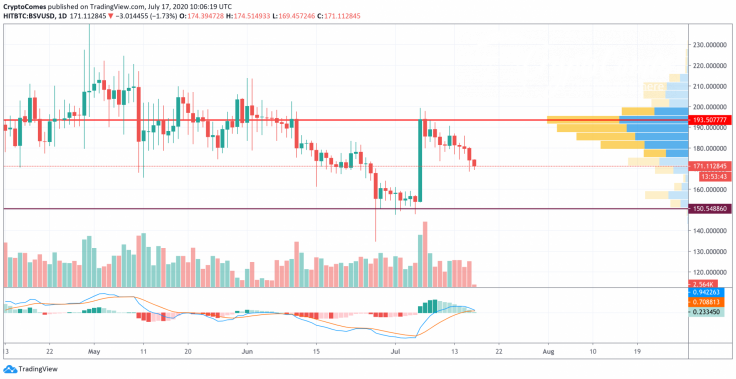
On the daily chart, sellers are also controlling the situation. The MACD is about to enter the bearish zone, which will confirm the ongoing decline. The selling trading volume is also quite high, and the closest stop may be the support of $150. Such a scenario is relevant until the end of summer 2020.
Bitcoin SV is trading at $171.63 at press time.


