The cryptocurrency market is becoming more bearish as fewer coins are located in the green zone. Only Chainlink (LINK) is under the bullish influence, rising by 2.54% over the past day.
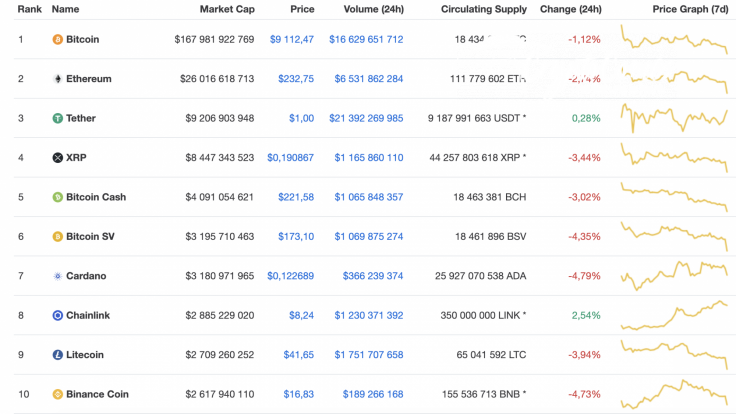
Key data for Ethereum (ETH), XRP and Stellar (XLM):
|
Name |
Ticker |
Market Cap |
Price |
Volume (24h) |
Change (24h) |
|
Ethereum |
ETH |
$26 016 618 713 |
$232,75 |
$6 531 862 284 |
-2.74% |
|
XRP |
XRP |
$8 447 343 523 |
$0,190867 |
$1 165 860 110 |
-3.44% |
|
Stellar |
XLM |
$1 845 640 859 |
$0,090359 |
$436 984 080 |
-0.06% |
ETH/USD
As usually occurs during a decline, Ethereum (ETH) is plunging faster than Bitcoin (BTC). The drop is 3.44% over the previous 24 hours.
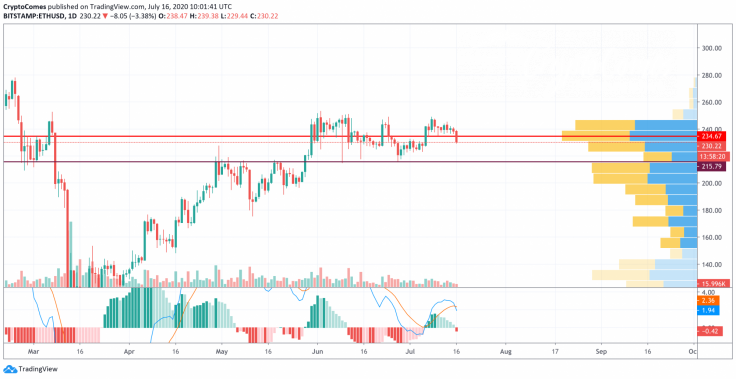
On the daily chart, the leading altcoin could fix above the $230 mark. Trading seems unlikely to increase, which means that the drop may continue. The MACD indicator lines have just entered the bearish zone, confirming ongoing pressure by sellers. The closest mark at which bulls might show resistance is $215, a far retest of June 27.
Ethereum is trading at $229.94 at press time.
XRP/USD
XRP is the top loser in our list. The altcoin has declined by 3.44% since yesterday and keeps plunging deeper. Meanwhile, the price change over the past 7 days is 6.85%.
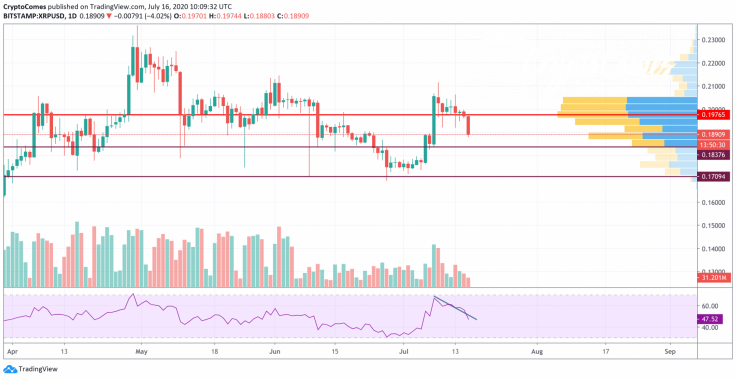
XRP could not hold the level of $0.20 against a decreasing trading volume. What's more, there is not enough liquidity in this zone. In addition, the RSI indicator has formed a bearish divergence and has not reached the oversold area yet. To sum up, the more likely scenario is a decline to the nearest support at $0.1837. In case bears break it, the next stop will be $0.17.
XRP is trading at $0.1895 at press time.
XLM/USD
XLM can be considered an exception to the rule as its price drop has constituted only 0.06% over the last 24 hours.
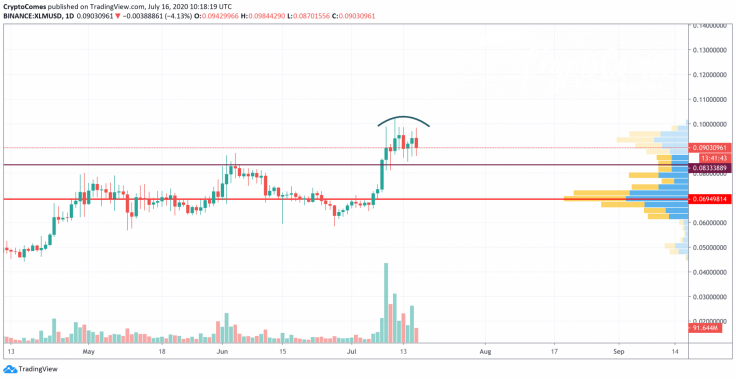
However, the decline might only be a matter of time, as trading volume is slightly declining while the coin keeps trading at the same level. Also, liquidity is low to keep Stellar (XLM) in the area around $0.10. For this reason, traders may expect a drop to the closest support at $0.0846 shortly.
Stellar is trading at $0.09 at press time.


