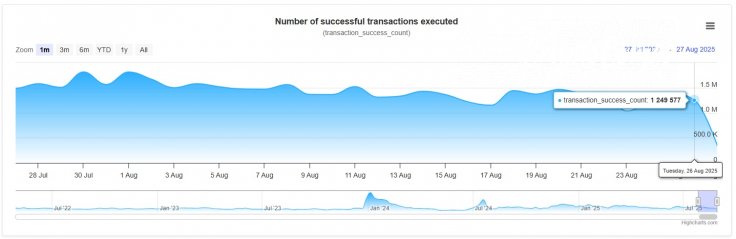
With both its price movement and on-chain data demonstrating active user participation, XRP is still attracting market attention. Ripple’s ledger statistics show that on Aug. 26, 2025, 1,249,577 successful transactions were completed in a 24-hour period. Although this may seem like a bullish catalyst, the on-chain dynamic is actually quite normal. Instead of a sharp increase in adoption or utility, transaction counts have been circling around this level for weeks, indicating normal activity.
XRP price comfort zone
Technically speaking, the price of XRP provides a more interesting narrative. XRP has been consolidating since early August within an ascending symmetrical triangle, and it is currently trading just under $3. According to this pattern, the market is preparing for a big breakout. The 200-day EMA is still comfortably below it, providing bulls with a positive technical backdrop, while the 50-day and 100-day EMAs are lined up as immediate support. The triangle’s decreasing range suggests that decisive action is likely to be taken in the upcoming weeks.
What's driving XRP momentum?
Neither overbought nor oversold conditions are shown by the Relative Strength Index, which is trading close to neutral levels. When coupled with steady trading volume, this shows a balanced market, with buyers and sellers holding off on making larger bets until they have confirmation. In this regard, XRP’s on-chain transactions, which are consistent and predictable, are not what is driving its price resilience. Rather, the relationship between technical levels and price is what is driving momentum.
There is a greater chance of an upside breakout as long as XRP keeps support above $2.70-$2.75. A push above $3.10 could lead to $3.40 and higher. XRP’s 1,249,577 transactions in a single day, in summary, highlight its steady network usage but do not account for the price increase. The compressing triangle pattern, moving averages and trendline support are the true technical drivers. Traders are now keeping a close eye on XRP as it gets closer to the tip of this formation; a breakout would indicate the asset’s next frontier.