XRP is steadily recovering from its bearish fall and resumes its never-ending path to $0.50. Will it ever break the target this year? What to expect from Ripple in the nearest time – a slow up and down a rollercoaster, or steady growth to $0.50 target? Users from TradingView know the answer to this question: let’s read their XRP price predictions.
XRP/BTC bullish again?

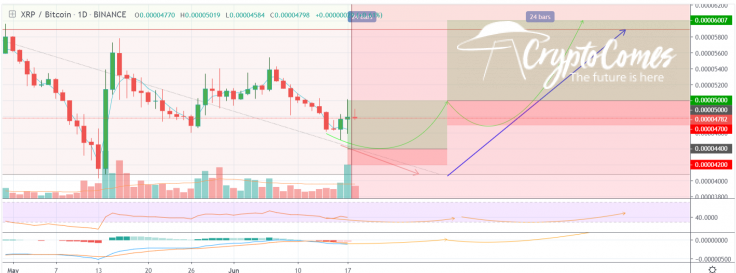
XRP is trying, again and again, to run away from the main support of 0.000040 BTC in order to fly in the direction of 0.000060 BTC resistance. Generally, when XRP does it, it moves very fast, however, the past few days show us that some key level of price is very hard to break. For This reason, XRP could use two different waves to achieve the 0.00006 resistance.
Speculating on its behavior, cryptogabri has found two main "entry levels" with relative "target price" and "stop loss", even though the price will probably follow the blue arrow for most of the case.
So, how to trade XRP now? There are two options:
-
1° Trade: Buy 0.000044 BTC; Stop loss 0.000042 BTC; Target price 0.00005 BTC in long term, 0.000047 could be great in the short term. Reward/Risk = from 1,5 to 3 ( it depends on the target you choose)
-
2° Trade: Buy 0.000050 BTC; Stop loss 0.000047 BTC; Target price 0.000060 BTC in long term, 0.000056 in the medium term, 0.000054 in a short term. Reward/Risk = from 1,5 to 3 ( it depends on the target you choose)
It’s possible that the whole bull run will take place in just one day. If the price is missing, the first trade remaining above 0.000044 BTC, you can go directly to the second trade of 0.000047 BTC.
Triangle is about to explode

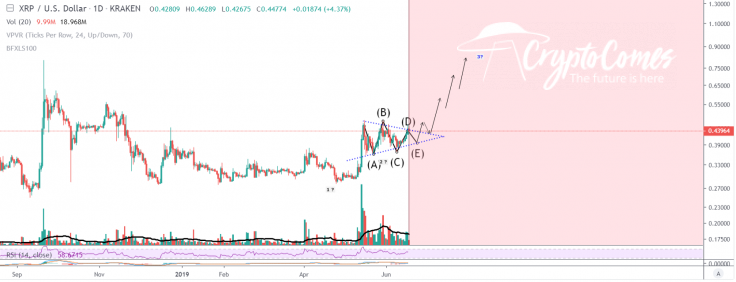
On the price chart from YinYangCrypto, we see an interesting formation with XRP/USD on the daily timeframe. Looking on the chart you can see that XRP/USD is forming a bullish triangle which is just ready to complete. Also, there’s a possible Elliot wave count with wave 1 and 2 just seeming like completed. When we break this triangle and confirm it, XRP/USD can explode and form wave 3 of the wave count. It should take it to the new heights, for instance, $0.50 or even $0.80.
It’s all thanks to the MoneyGram news

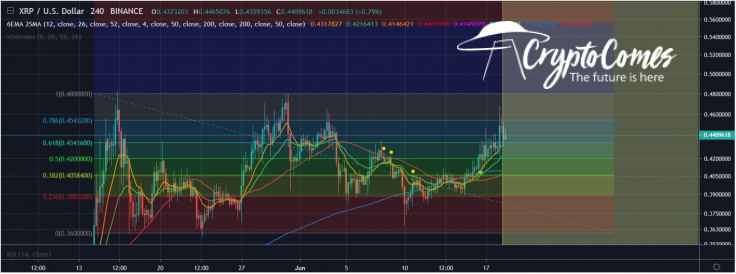
This week, in the short term Fibonacci Retracement levels of XRP/USD, XRP has broken through the .5 and .618 Fib levels. A test of the .786 level also took place, however, XRP has mostly been trading between the .786 and .618 levels.
A test of the previous highs of the $0.48 range (last tested on May 31) looks possible, however upwards momentum cannot wane in order for this to take place, as the .786 Fibonacci level still needs to be tested before testing the $0.48 high. Momentum especially cannot wane for a break above $0.48 to happen, as this would indicate clear skies until the mid $0.50 range.
The MoneyGram news has resulted in bullish momentum picking up in recent hours as the news leads to the break of the .618 level. Follow through on this move remains to be seen, and this depends heavily on Bitcoin.
To $0.8 in the long term

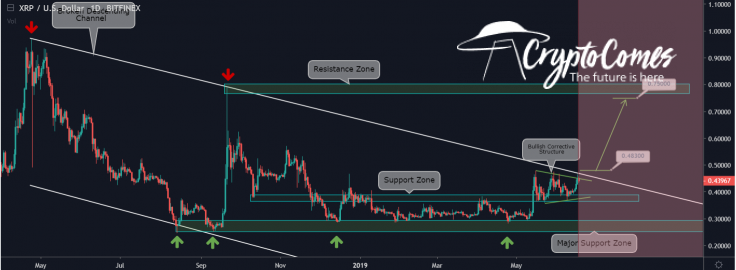
Here’s an interesting daily XRP chart from ThinkingAntsOk. We observe that:
-
Price is on a Descending Channel since April '18.
-
It bounced on the Support Zone and is currently on a Bullish Corrective Structure.
-
If price breaks the Descending Channel at 0.483, it has the potential to move up towards the Resistance Zone at $0.75-0.80.
Sounds fantastic, but it won’t happen earlier than August 2019, of course.
Final thoughts
XRP has new serious resistance zones ahead. Will it be able to break them? Mostly, technical indicators are positive and we can expect a positive tendency. However, if Bitcoin decides to nosedive, XRP will definitely follow its lead.
Ripple (XRP) price charts by TradingView


