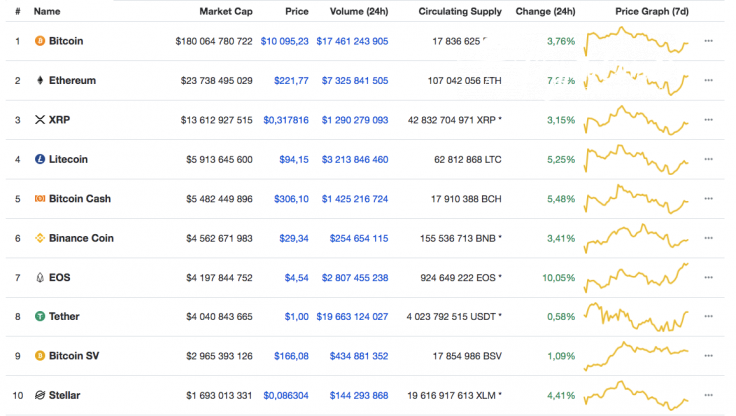
The cryptocurrency market has regained the lost $10 Bln over the night. However, the rates of most coins have increased in correlation to US Dollar, not to Bitcoin. The biggest gainer is EOS, whose price has gone up by 10% over the past 24 hours.

So, the rate of coins against BTC slightly differs. Let’s get to charts for better understanding the technical picture of top cryptocurrency.
XMR/BTC
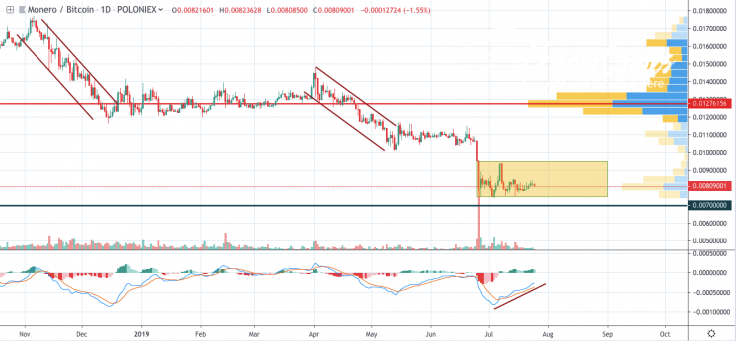
Once BTC’s rate has gone up, the price of Monero has lost around 2% of its price compared to its yesterday position.

Monero has touched the bottom on the 1D chart, and a slight recovery might occur. The rising MACD indicator confirms such price movements. Analyzing the historical background, XMR suffered two bearish waves, followed by a sideways trend.
The price is likely to locate in the yellow range until the end of summer, however, it will happen only if trading volume is high.
The price of XMR is trading at 0.008110 BTC at the time of writing.
DASH/BTC
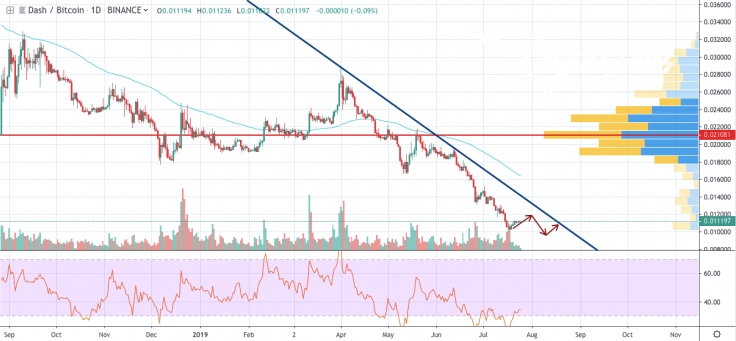
Even though the rate of DASH has increased by 0.5% over the day, the general picture remains bearish.

According to the chart, DASH has been declining since April 1, and there are no signals of a possible reversal. The RSI indicator is located near the oversold area, however, DASH is going to strike neither in the short no in the long-term scenario. Overall, the price is likely to fluctuate with a further drop to the area of 0.01 BTC.
The price of DASH is trading at 0.0111 BTC at the time of writing.
XEM/BTC
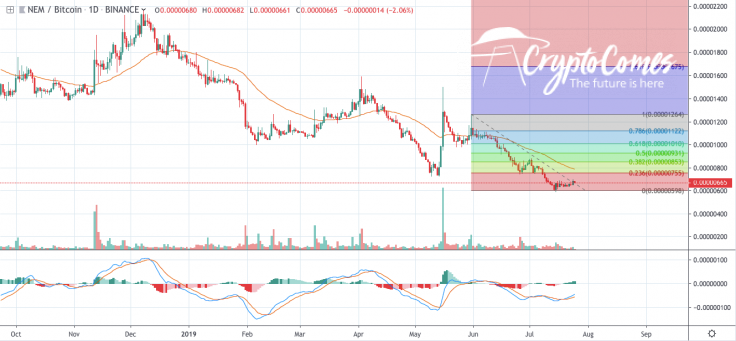
XEM is a vivid gainer today, as its price has increased by 2% over the day. However, there is nothing positive in terms of a long-term scenario.

On the 1D chart, XEM is located at its lowest levels over the previous 2 years. Applying the Fibonacci retracement to the chart, the coin is likely to bounce back to the point of 755 satoshi (23.6%).
The MACD indicator also confirms a possible recovery, as its lines are looking upward.
The price of XEM is trading at 0.00000665 BTC at the time of writing.


