Ripple is moving sideways after the major market break in the previous week, and traders continue guessing whether the long-awaited $0.5 target is possible to hit in summer 2019.
Wonder how to trade XRP in the upcoming days? Check the best strategies and Ripple price forecasts published by TradingView users.
$0.5 by the end of July?

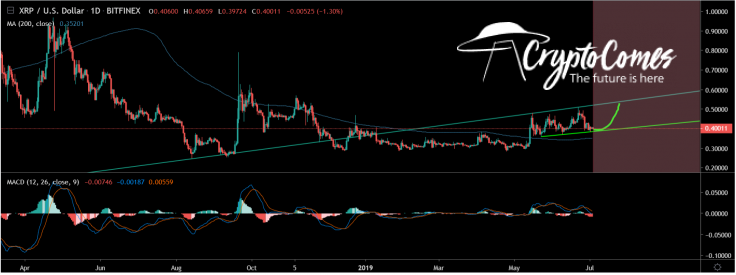
On the price chart from Coin_For_peace, we see that XRP is on the bottom trendline of a channel and it could skyrocket to the upper trendline.
Traders are all eyes on the $ 0.5 zone because there is an important resistance but, should the prices push through it then XRP could skyrocket to test the upper trendline.
If you decide to trade XRP, remember to put a stop loss just under the trendline.
XRP is pretty stable since a week and demonstrated pretty resiliency during the last BTC correction, but volumes are low – this is the main problem with it now.
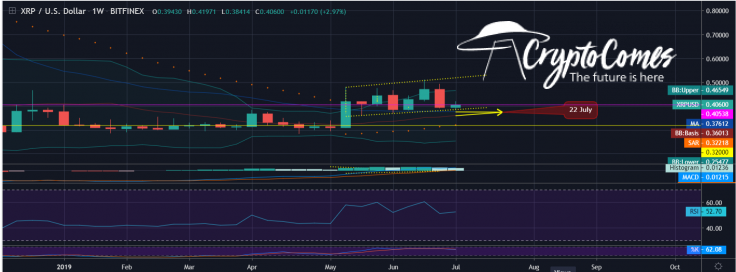
Expect a breakout after July 22

XRP has been stagnant despite the various news and TA we've seen over the past few months.
The daily charts have shown a golden cross, but we've only seen the channeling of the token between $0.30 to $0.50. In the coming weeks, we should see the next big MA crossover coming around July 22nd which could trigger a breakout.
XRP continues to follow the general ups and downs of BTC, but without the gains, as seen in other currencies.
The most optimistic scenario

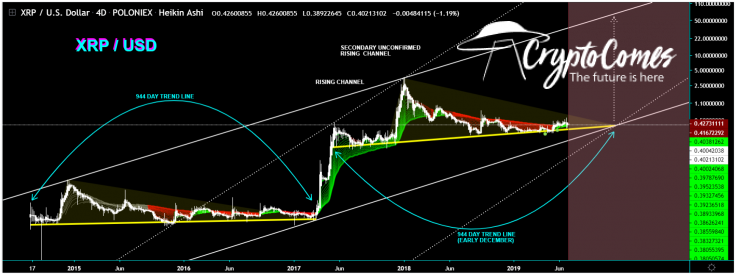
Ripple (XRP) price chart from CryptoManiac101
So, how high can Ripple get in the medium term? Here’s a very interesting price analysis from CryptoManiac101. Take your time to analyze it and determine some very similar movements/fractals from last time we were riding on trend line to today.
Currently we are sitting on a 790+ Day Support in a form of a Trend Line. Last time we had similar trend line, it took just around 944 days before we saw an immense breakout occur.
If we were to repeat same exact pattern, we would be looking at December of 2019 for similar breakout but this time we will be going over $50 with possible short term pit stop at $5 - $15.
Yet, if we put away fractals, we can expect a breakout anytime from now on and since price is being artificially controlled at this time, there's no telling when exactly the wall between institutional side and retail side break.
Interesting to note, back from 2014 towards early 2017 we’ve observed a similar pattern where we had an exceptionally long support line and accumulation followed by over 80,000% uptrend from support line.
BTC/XRP trade options

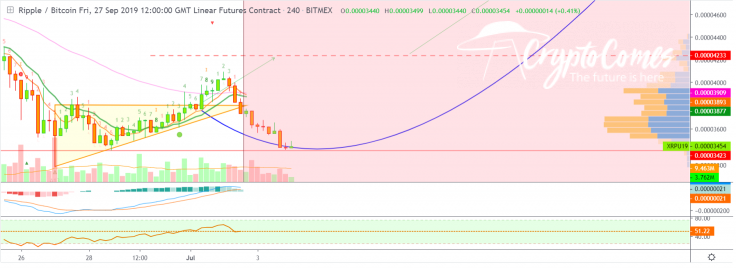
While Ripple is somewhere close to the bottom, it’s high time to buy new tokens. Here’s a short XRP trade guide from alanmasters. Although it was published at the beginning of the week, it’s still applicable:
Trade: LONG XRPU19 (Ripple)
Leverage: 5X
Buy-in: 0.00003577 – 0.00003720 (or $0.40 if late).
Targets:
(1) 0.00003860
(2) 0.00004000
(3) 0.00004200
(4) 0.00004400
(5) 0.00004600
(6) 0.00004800
Stop-loss: Close (1D) daily below 0.00003300.
Liq. price: 0.00003102
(Buy-in calculated at 0.00003720)
Potential profits: 138.25% ROE for several targets
The first targets have already been hit, and Ripple can touch these heights again in the following days bringing us 18-40% profit.
Final thoughts
Judging from the charts, Ripple is bearish in the short term, but long term perspectives are very bullish. If the move to $0.5 happens, XRP will soar to the moon.
Orienting on Bitcoin doesn’t make any sense yet – Ripple keeps following it but without any major price fluctuations.
Ripple plans to make a massive $500 million investment into the XRP ecosystem soon – it might be a serious price trigger.
Ripple (XRP) price charts by TradingView


