
A bullish mood has been combined with a bearish one as neither bulls nor bears are dominating the market at the moment. Polkadot (DOT) is the main loser from our list, falling by 4.73% since yesterday.
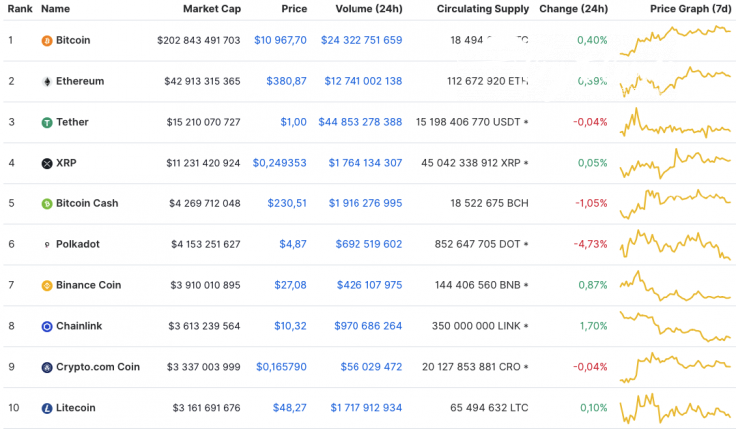
The main information for Polkadot (DOT), Tron (TRX) and Chainlink (LINK) today:
|
Name |
Ticker |
Market Cap |
Price |
Volume (24h) |
Change (24h) |
|
Polkadot |
DOT |
$4,153,251,627 | $4.87 | $692,519,602 | -4.73% |
|
Tron |
TRX |
$1,979,635,668 | $0.027626 | $3,011,846,766 | -2.77% |
|
Chainlink |
LINK |
$3,613,239,564 | $10.32 | $970,686,264 | 1.70% |
DOT/USD
Polkadot (DOT) is the top loser from our list, as well as the top loser among the Top 10 cryptocurrencies. The price of the coin has gone down by almost 5 percent over the previous 24 hours.
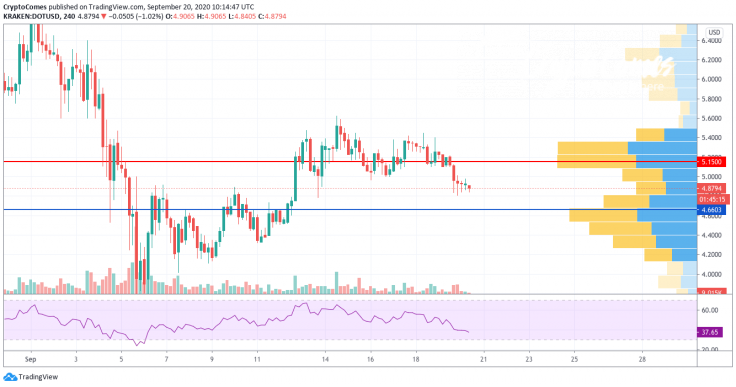
On the 4H chart, Polkadot (DOT) keeps falling within the descending channel. The selling volume keeps increasing; however, the coin has almost reached the verge of the oversold area based on the RSI indicator.

In this case, one may expect a false breakout of the support at $4.66 where most of the liquidity is focused.
Polkadot (DOT) is trading at $4.85 at press time.
TRX/USD
Tron (TRX) is another loser from our list. Its rate has declined by 2.77 percent since yesterday, while the price change over the last week has made up -14.57 percent.
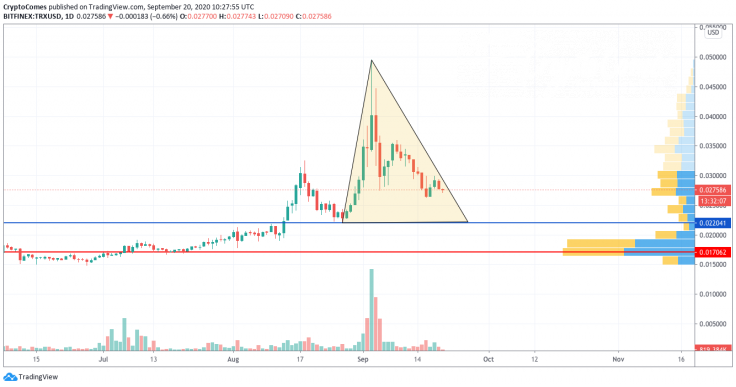
The decline of Tron (TRX) is about to continue even though the rate of the coin is already located in the bearish zone. Liquidity is still low, which means that buyers are not ready to buy at the current prices. On the 4H time frame, the triangle figure is being formed with the endpoint at $0.022. If bulls do not hold this mark, the drop may continue to $0.017.
TRX is trading at $0.027 at press time.
LINK/USD
Chainlink (LINK) is an exception to the rule as it is the only coin from our list that is in the green zone. It has added 1.70 percent to its price share over the last day.
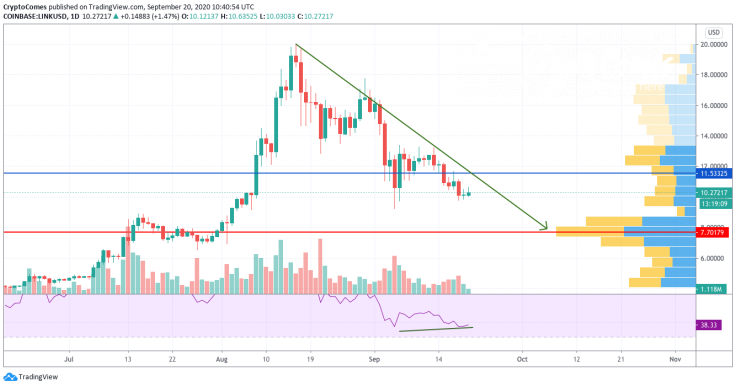
Chainlink (LINK) may not have finished its short-term growth yet, as bulls have found support at the crucial $10 mark. However, the rise is not going to last long as the volume is low and the trend reversal has not started yet. For this reason, growth may continue to the $11.53 mark, followed by a decline to $7.70.
LINK is trading at $10.27 at press time.


