
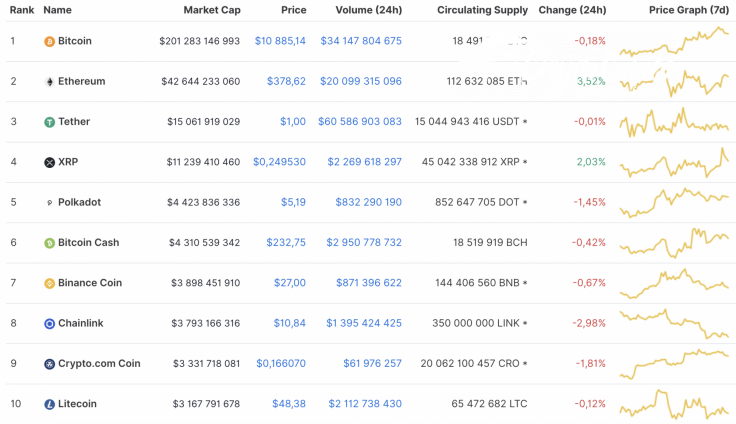
Most of the cryptocurrency market has switched to red as almost all of the Top 10 coins are in the red zone. Ethereum (ETH) and XRP are the only exceptions to the rule, and their rates have grown by 3.52% and 2.03%, respectively.
The crucial statistics for Chainlink (LINK) and Polkadot (DOT):
|
Name |
Ticker |
Market Cap |
Price |
Volume (24h) |
Change (24h) |
|
Chainlink |
LINK |
$3,801,516,881 | $10.86 | $1,397,487,564 | -2.79% |
|
Polkadot |
DOT |
$4,425,285,710 | $5.19 | $830,338,522 | -1.19% |
LINK/USD
Chainlink (LINK) is the biggest loser among the Top 10 coins. Its rate has declined by almost 3% since yesterday, while the price change over the last week has been -15.77%.
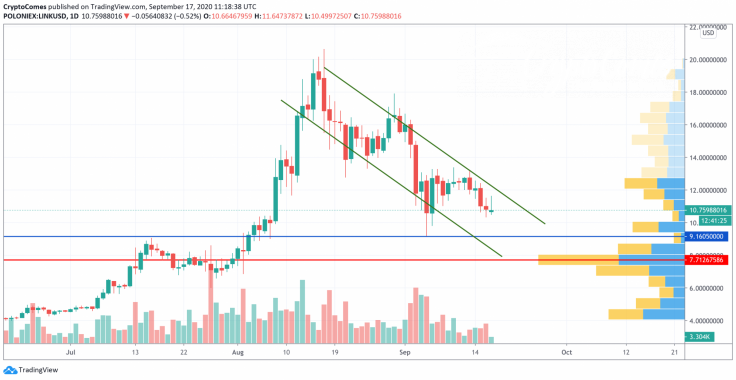
On the daily time frame, Chainlink (LINK) keeps trading in a falling channel after it failed to fix above the $18 mark. From the technical point of view, the drop has not finished yet as liquidity, as well as trading volume, is low.

Thus, the altcoin has not reached its local support levels to make a reversal. In this case, traders may consider a further decline to $9.16 as the main scenario in which buyers might may resist and seize the initiative.
Chainlink is trading at $10.82 at press time.
DOT/USD
Polkadot (DOT) is not as bearish as Chainlink (LINK); however, it has also lost 1.19% of its price over the previous 24 hours.
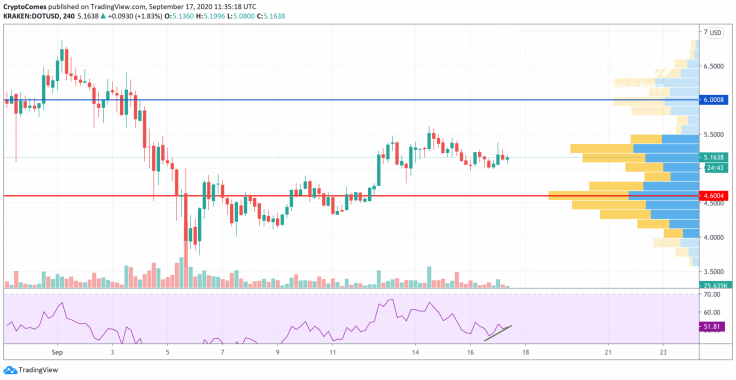
Polkadot (DOT) has been trading within an ascending channel since Sept. 5. The bullish divergence on the RSI indicator confirms bullish power. On the other hand, it is not enough to update the peaks as the trading volume is going down and the main liquidity is focused in the area of $4. To sum up, a false breakout of the resistance at $6 may be considered as the most likely scenario.
Polkadot is trading at $5.16 at press time.


