Bulls remain more powerful than bears on the cryptocurrency market. Almost all of the Top 10 coins are in the green zone except for XRP and Binance Coin (BNB), whose rates have declined by 0.14% and 3.26%, respectively.
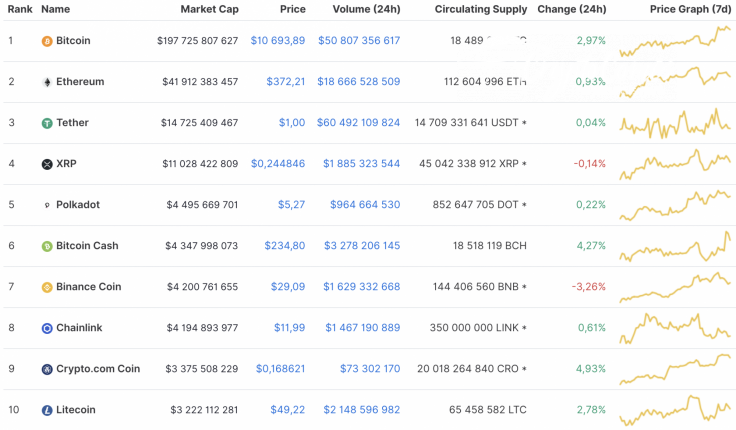
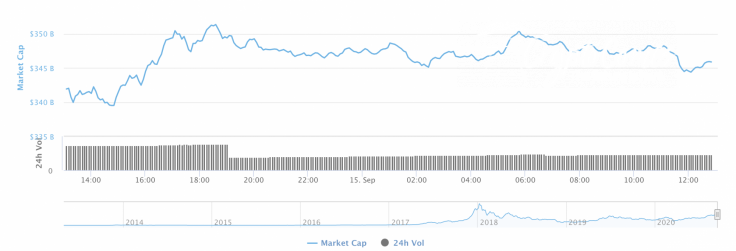
The overall market capitalization keeps rising and currently sits at $347 bln.
The relevant Chainlink data is looking the following way today:
-
Name: Chainlink
-
Ticker: LINK
-
Market Cap: $4,192,856,132
-
Price: $11,98
-
Volume (24h): $1,473,944,074
-
Change (24h): 0.32%
The data is relevant at press time.
LINK/USD: Can the drop to $10 continue before bulls seize the initiative?
The rate of Chainlink (LINK) has not increased that much over the last day compared to other altcoins. The rate has grown by 0.32%.
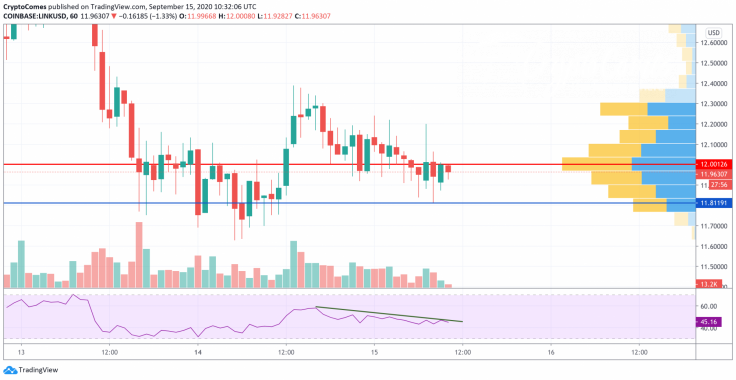
On the hourly chart, Chainlink (LINK) has retested the support zone at $11.80 where bulls have shown their power. However, the buying trading volume is not enough to keep growth to the local peak level. What is more, the RSI indicator has formed a bearish divergence, which confirms the strong position of sellers. In this case, there is a high probability of seeing LINK at the support of $11.80 soon.
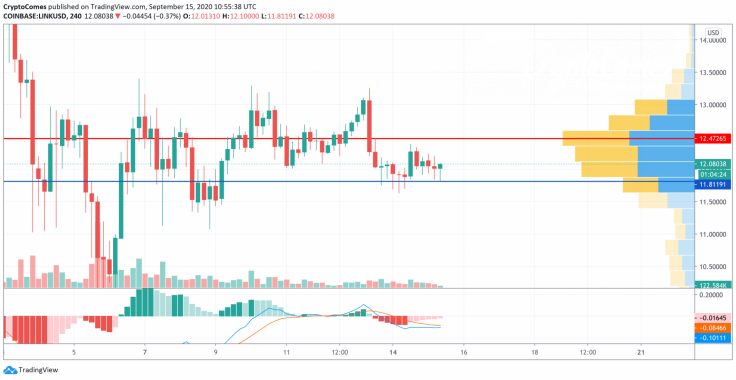
On the 4H time frame, bulls have confirmed the short-term rise of Chainlink (LINK), which is supported by high liquidity. In addition, the lines of the MACD indicator have almost entered the green zone. If growth continues, the altcoin may get to the nearest resistance zone at $12.47 by the end of the week.
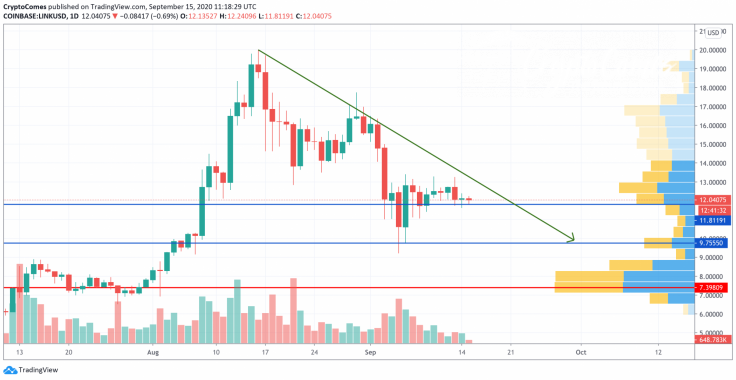
On the daily chart, the situation is rather bearish than bullish. Chainlink (LINK) has bounced off the support at $11.80; however, it is not enough to keep growing as the liquidity, as well as the volume, is low. That is why the more likely scenario is another wave of decline to $9.75 before a new bull run starts.
Chainlink is trading at $12.05 at press time.


