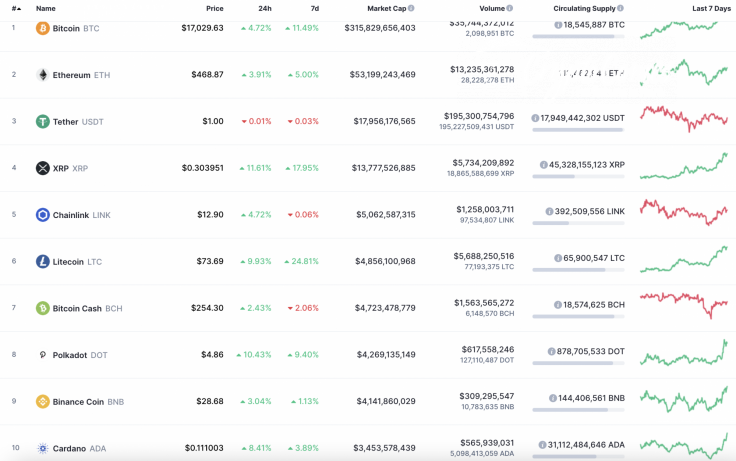
Bulls have seized the initiative as all Top 10 coins are now located in the green zone. XRP is the main gainer among them, rising by 11.61% over the last day.
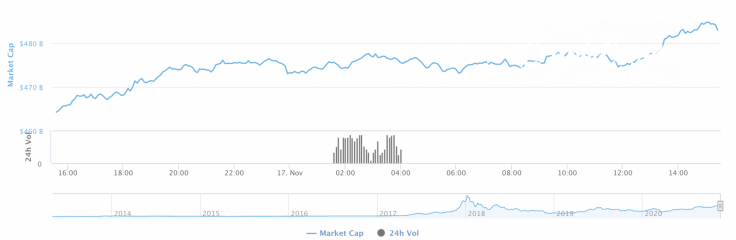
The total market capitalization index has also increased by around $20 bln since yesterday and now makes up $482 bln.
The relevant data for Bitcoin is looking the following way today:
-
Name: Bitcoin
-
Ticker: BTC
-
Market Cap: $314,965,287,242
-
Price: $16,983.03
-
Volume (24h): $36,091,697,170
-
Change (24h): 4.30%
The data is relevant at press time.
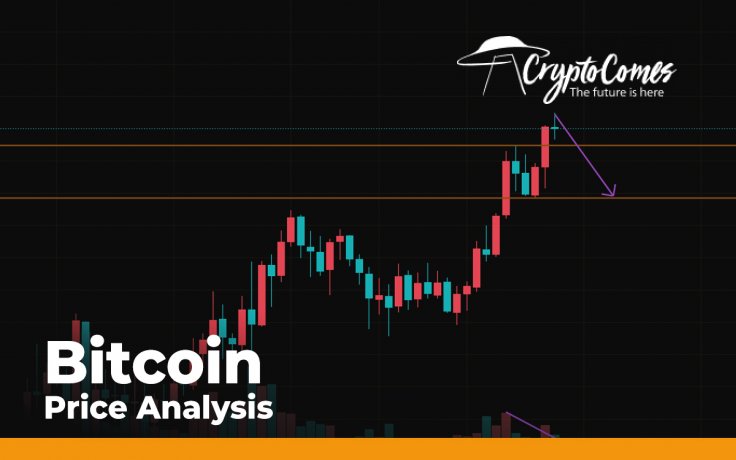
BTC/USD: Is the next market $20,000 after breaking $17,000?
Bitcoin (BTC) is not going to stop its bull run, and another peak at $17,000 has been achieved. In total, the rate of the main crypto has risen by more than 10% over the past 7 days.
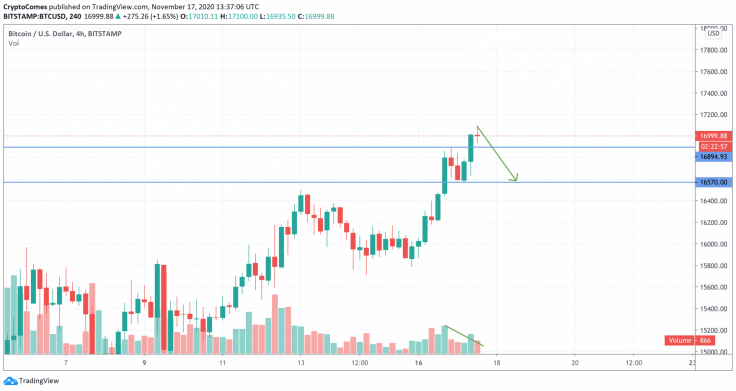
On the 4H chart, bulls are getting weaker, which is confirmed by the declining trading volume. Even though the bullish trend remains relevant, Bitcoin (BTC) may go down to the support at around $16,500 to get more power for the upcoming rise.
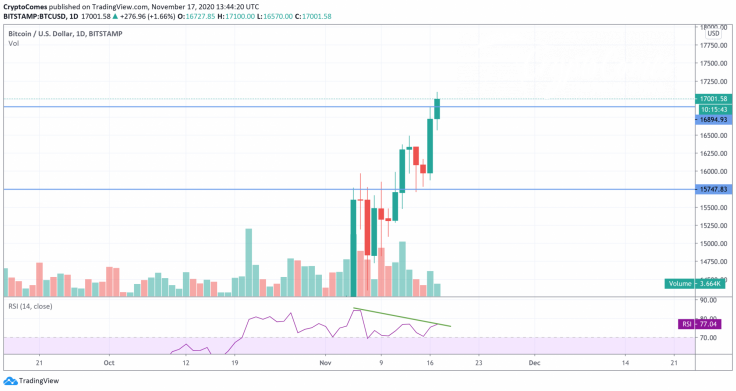
On the daily time frame, the bearish divergence has been formed, which means that a correction may arrive soon. Moreover, the RSI indicator is already located in the overbought zone. If bulls fail to fix above the vital $17,000, sellers may push Bitcoin (BTC) down to the $15,800 mark.
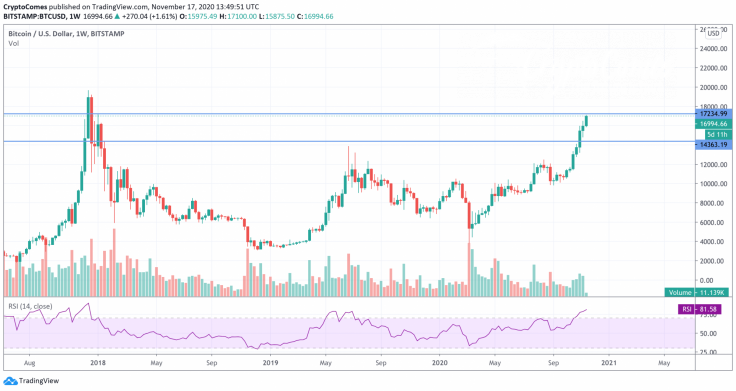
On the weekly chart, the resistance at $17,200 remains the last one before an attempt to fix a new all-time high level. Also, RSI is overbought, which considers a possible decline. However, if the chief crypto can fix above the support, it may reach $20,000 by the end of the year.
Bitcoin is trading at $16,975 at press time.


