The last day of the week has turned out to be neither bullish nor bearish as some coins have entered the correction phase, while the rates of others keep rising.
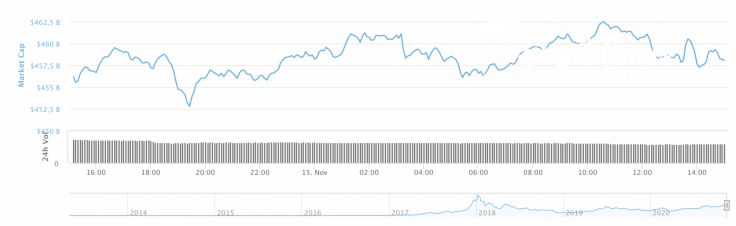
Although there is slight uncertainty on the market, its capitalization index has risen by $2 bln and is now at $458 bln.
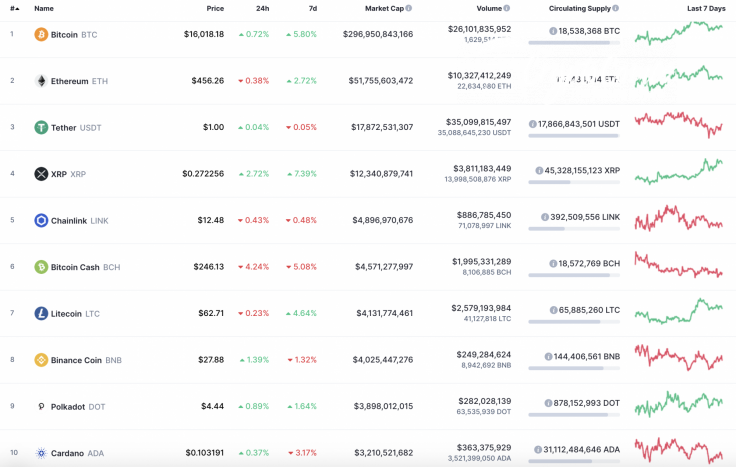
The relevant data for Bitcoin today:
-
Name: Bitcoin
-
Ticker: BTC
-
Market Cap: $296,180,734,012
-
Price: $15,976.63
-
Volume (24h): $26,026,327,113
-
Change (24h): 0.35%
The data is relevant at press time.
BTC/USD: Are bulls going to reach $16,500 next week?
Bitcoin (BTC) is the biggest gainer among the Top 3 coins over the last week. The price change has constituted 5% while its rate has increased by only 0.35% since yesterday.
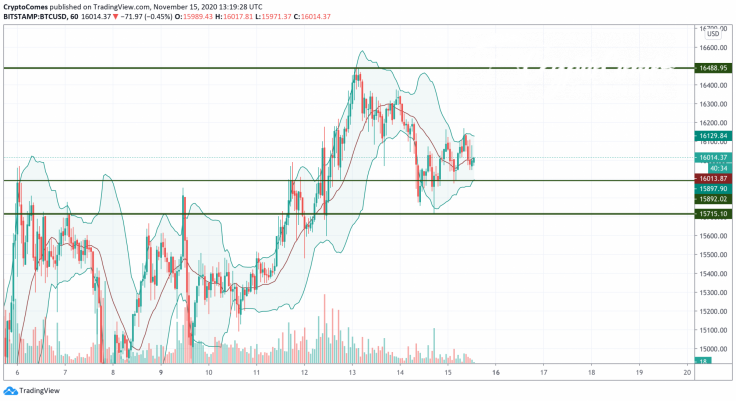
On the hourly chart, the leading crypto is located between the support of $15,900 and the resistance at $16,500. The bullish trend remains relevant as bears have not seized the initiative over the weekend. However, to keep rising, buyers need more energy. In this case, one may expect a short-term decline to the support line of the Bollinger Bands indicator at $15,900.
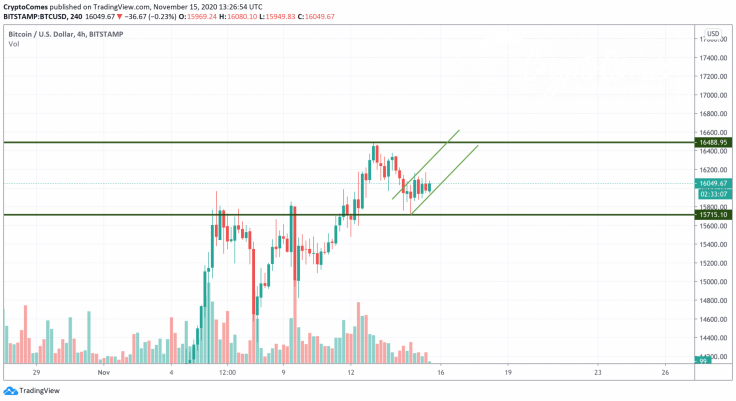
On the bigger time frame, the situation is reversed. The selling volume keeps declining, which means that sellers are not going to push the rate of Bitcoin (BTC) down.

Thus, the rising channel has not been broken yet, confirming bulls' potential. If nothing changes, the peak of $16,500 may be retested at the beginning of next week.
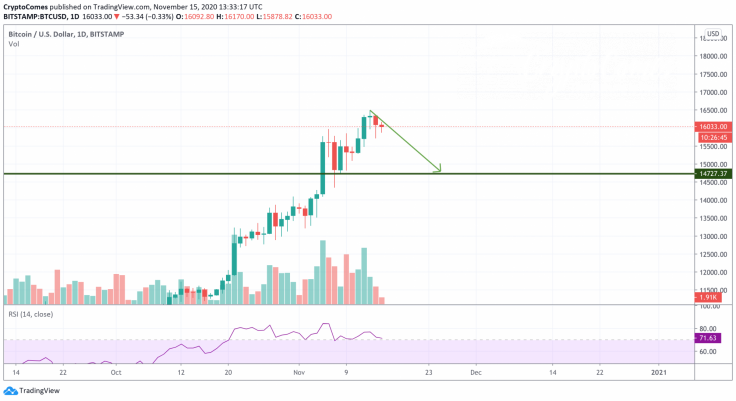
On the daily chart, Bitcoin (BTC) is overbought based on the RSI indicator. Although the short-term perspective is bullish, the correction is about to happen soon. If bulls fail to fix above $16,000, the closest vital support that maybe tested by the end of the month is $14,800.
Bitcoin is trading at $16,076 at press time.


