Traders might have started fixing their positions as almost all of the Top 10 coins are in the red zone. XRP and Bitcoin Cash (BCH) are the only exceptions to the rule.
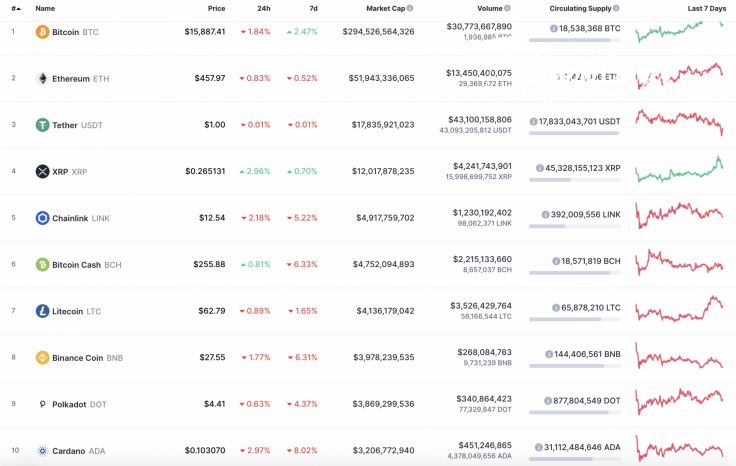
The important statistics for Bitcoin (BTC), Ethereum (ETH) and XRP today:
|
Name |
Ticker |
Market Cap |
Price |
Volume (24h) |
Change (24h) |
|
Bitcoin |
BTC |
$294,526,564,326 | $15,887.41 | $30,773,667,890 | -1.84% |
|
Ethereum |
ETH |
$51,943,336,065 | $457.97 | $13,450,400,075 | -0.83% |
|
XRP |
XRP |
$12,017,878,235 | $0.265131 | $4,241,743,901 | 2.96% |
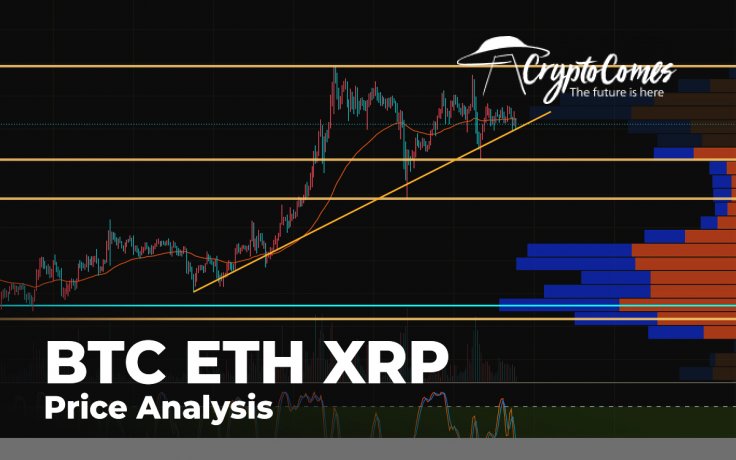
BTC/USD
Even though Bitcoin (BTC) has declined by 1.84% since yesterday, the current week has been positive for the main crypto. Its rate has increased by 2.47%.

On the daily chart, Bitcoin (BTC) might face a correction soon, although the bullish trend has not been broken yet. The trading volume is going down slightly, which means that buyers are losing their efforts and are unable to fix above $16,000 from the first attempt. In this case, the short-term drop to $14,000 is the more likely scenario.
Bitcoin is trading at $15,877 at press time.
ETH/USD
Ethereum (ETH) could not show as much growth as the chief crypto. The rate of the main altcoin has even reduced by 0.52% over the last 7 days.
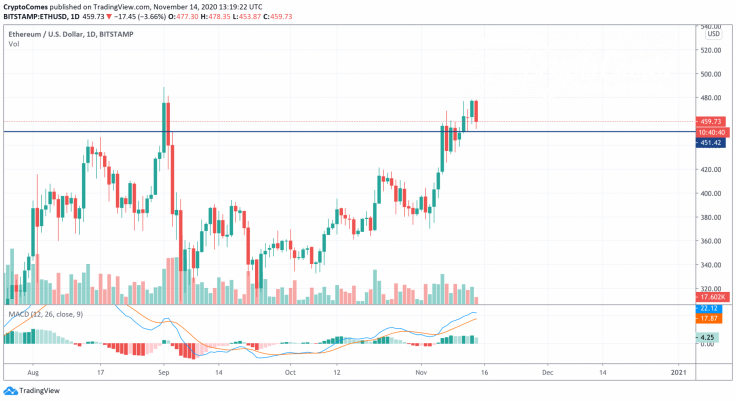
According to the technical analysis, Ethereum (ETH) is also unlikely to keep growing without a correction. The current daily candle is about to absorb yesterday's, which may confirm bears' pressure. Thus, the MACD indicator might switch to red soon. If that happens, the next target at which bulls might seize the initiative is $450.
Ethereum is trading at $460.33 at press time.
XRP/USD
XRP is the only coin from today's list whose rate has risen over the last day. The price change has accounted for almost 3%.
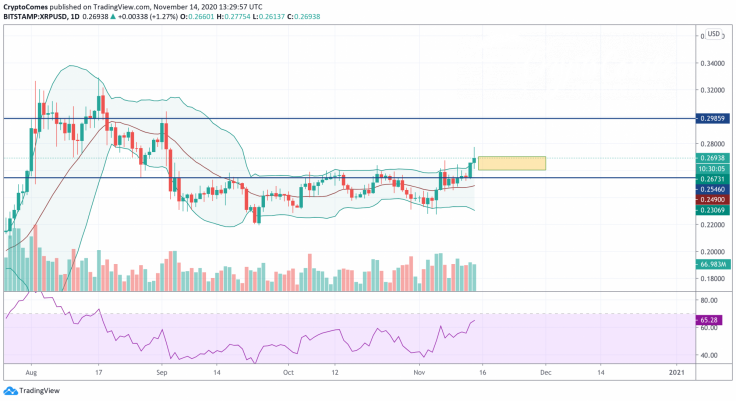
XRP has fixed above the crucial zone at $0.2546—a recent support. According to the Relative Strength Index indicator, the coin has not reached the overbought zone yet. This means that growth potential remains.
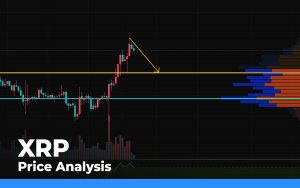
However, to gain more effort, XRP needs to accumulate more power within some time. This is why sideways trading in the $0.26-$0.27 range is the more likely scenario.
XRP is trading at $0.2677 at press time.


