Most of the cryptocurrencies keep rising. However, the growth is not as fast as it was before. Bitcoin (BTC) is the fastest growing coin in the Top 10 list over the past 24 hours.
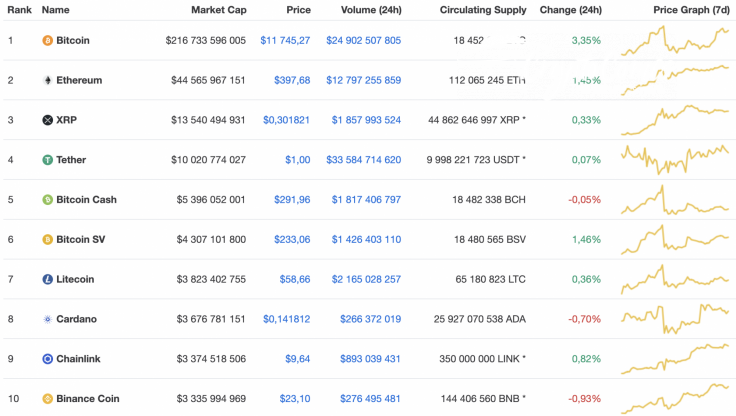
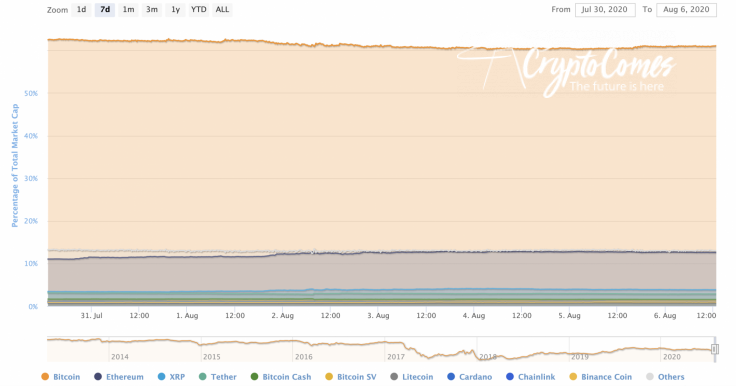
Although Bitcoin (BTC) is rising faster than most of the altcoins, its dominance rate has decreased by 1% over the last week and currently makes up 61.1% of the market.
The relevant Bitcoin data for today:
-
Name: Bitcoin
-
Ticker: BTC
-
Market Cap: $216,895,013,986
-
Price: $11,754.02
-
Volume (24h): $24,914,675,653
-
Change (24h): 3.35%
The data is relevant at press time.
BTC/USD: Can the $12,000 mark be attained this week?
Yesterday, buyers resumed attempts to recover the Bitcoin (BTC) price and broke through the 50% Fibo resistance ($11,394). During the day, growth was supported by above average trading volume, but late at night, volume started to decline and growth stopped at around $11,800.
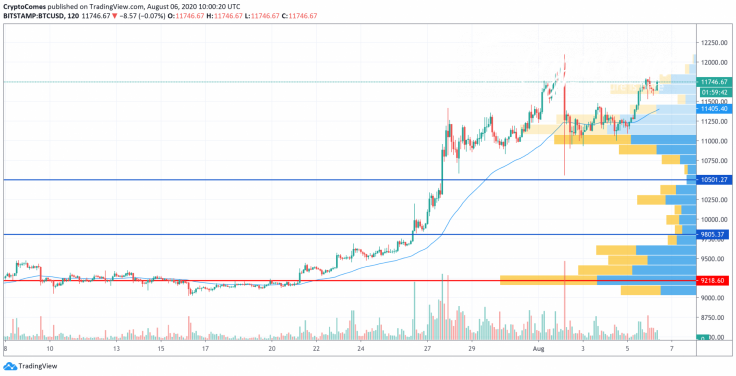
In the morning, the price pulled back and is currently holding in the area of $11,650. We believe that the pullback is not over yet, and the pair may find weak support at $11,500. If one of these levels stops the decline, then soon growth may continue to a new annual high, and Bitcoin (BTC) will test the $12,300 mark.
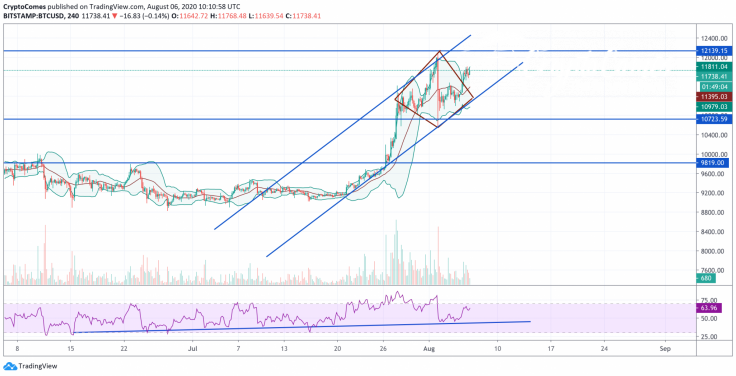
On the 4H chart, the quotes are squeezed within the diamond model. This structure can be a pattern of both a reversal and a trend continuation. Here traders might also observe the proximity of the support line on the RSI indicator, a rebound that may trigger the development of a new growth wave.
Therefore, one should not exclude a breakdown of the model upward and active growth. This idea will be confirmed by the breakdown of the upper border of the model with price fixing above the $11,565 level. In this case, Bitcoin can safely consider reaching the $13,045 mark in the near future. Cancellation of a positive forecast for buyers will mean a breakdown of the lower boundary of the model with price fixing below $10,775.
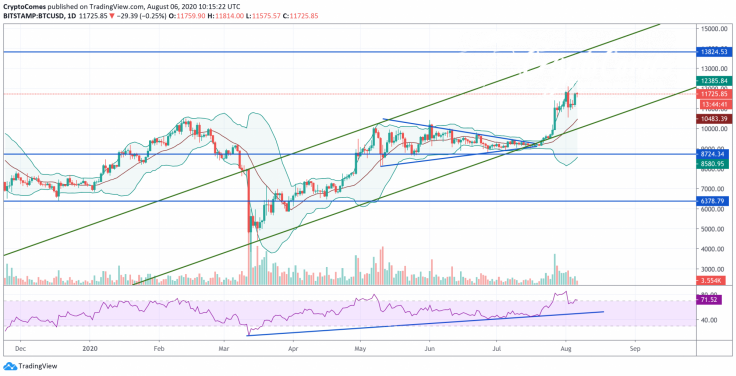
On the daily chart, Bitcoin (BTC) was able to break through important resistance, which indicates strong pressure from buyers as well as the market's reluctance to correct and move exclusively upwards. Now an important area of support is located at $10,240; a decline to that level may again provoke a rebound upward and continuation of the rise. The target of growth in this case is the $13,865 level. An additional signal in favor of this movement will be a rebound from the support line on the RSI indicator.
Bitcoin is trading at $11,718 at press time.


