The ongoing Bitcoin (BTC) run to levels unseen since January 2018 is surrounded by an amazing set of juicy on-chain metrics. Leading cryptocurrency data provider IntoTheBlock indicated some of them.
Bitcoin (BTC) addresses activity spikes
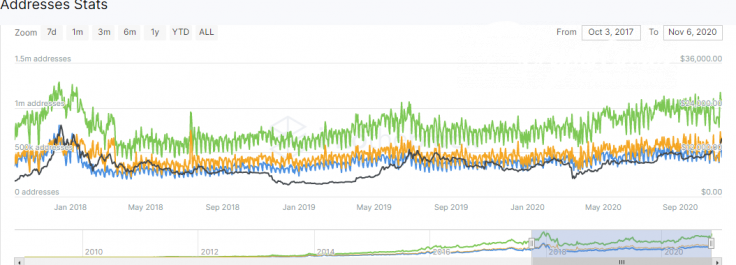
While bears erased the second attempt of Bitcoin (BTC) to hold above $16,000, network activity printed some interesting highs. The number of daily active addresses (Bitcoin network wallets involved in at least one transaction within 24 hours) touches a 34-month record.

On Nov. 9, this indicator surpassed 1,210,000 addresses. Last time it was so high was on Jan. 11, 2018, amidst the sunset of the 2017-2018 Bitcoin (BTC) rally.
IntoTheBlock analysts noted that this activity should mainly be attributed to whale-driven movements. Over the last week, more than $55 bln was transferred in $100,000+ on-chain transactions.
Some whales decided to send their riches to the exchanges. A total of $5.21 bln were transferred to trading ecosystems in the last seven days.
Strong hands refuse to capitulate
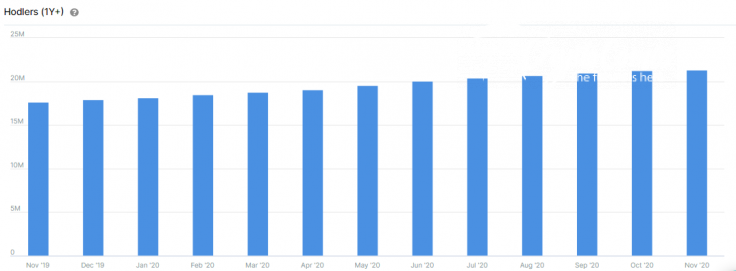
Other metrics show that "hodlers," i.e., the addresses that hold Bitcoin (BTC) for 12+ months in a row, have been strengthening their positions over the last year. Even the devastating carnage of Black Thursday in Crypto in March 2020 failed to challenge their confidence.

During the last few years, the number of "hodlers" surged from 17.64 mln to 21.29 mln, printing an unbelievable spike of almost 21 percent. The weighted average period of holding for this category also increased from 4.7 years to 4.9 years.
As covered by CryptoComes previously, the aggressiveness of holders was noticed by all cryptocurrency analytics firms.
In early Q3, 2020, Glassnode indicated that Bitcoin Hodlers' Net Position (the number of coins held by long-term investors) remains positive for many months.


