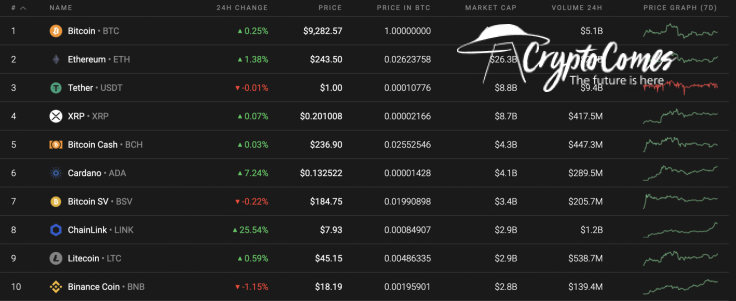
Market growth has continued, though some coins are performing much better than others. Today's leader, Chainlink (LINK), has gained 25% just in the last 24 hours.
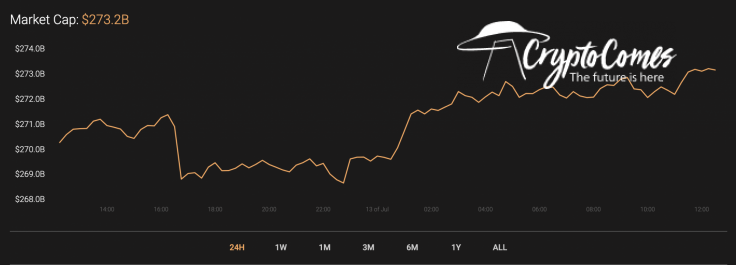
Against the increasing rise of altcoins, overall market capitalization has also gone up by $3 bln since yesterday, and now the index accounts for $273.2 bln.
The relevant Chainlink data is stacking up this way:
-
Name: Chainlink
-
Ticker: LINK
-
Market Cap: $2,767,195,313
-
Price: $7.91
-
Volume (24h): $1,643,087,511
-
Change (24h): 25.41%
The data is relevant at press time.
LINK/USD: Is the pump about to end?
Chainlink (LINK) is the biggest gainer of the top 10 coins. The rate of the token has skyrocketed by 25.54% over the previous 24 hours.
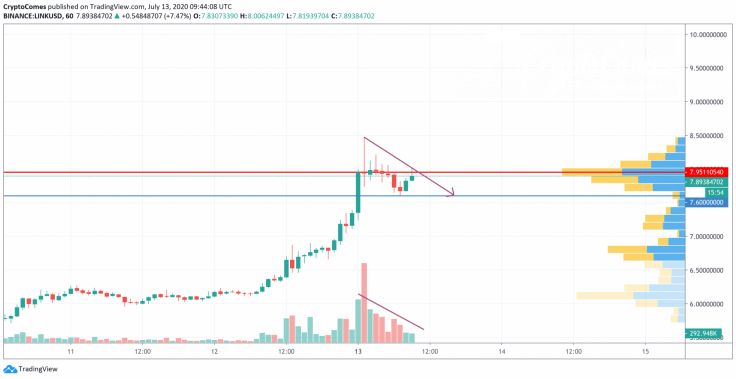
On the hourly chart, Chainlink (LINK) has reached its local peak at $8.45. The bullish trend does not seem to be ending, however; the altcoins might face a short correction before a continued rise. A declining trading volume confirms a possible drop. In this scenario, the nearest level at which the decrease might stop is $7.60.
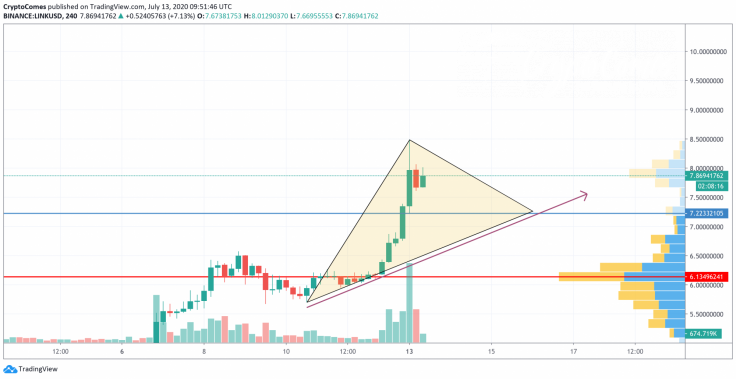
On a longer timescale, a correction is also the more likely forecast. Chainlink (LINK) is forming a Triangle pattern with the endpoint at $7.22, which is considered the last stop before possible continued growth. If the coin keeps decreasing, the aforementioned mark may be attained within the next few days.
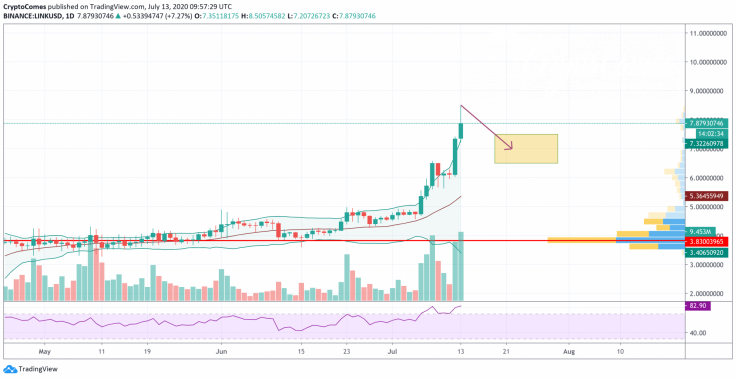
On the daily chart, Chainlink (LINK) is overbought based on the Relative Strength Index indicator. To keep growing, the coins need to accumulate power in the yellow range between $6.50 and $7.50. However, a further rise is possible only if the trading volume increases. Such a scenario is relevant until the end of the current month.
Chainlink is trading at $7.90 at press time.


