

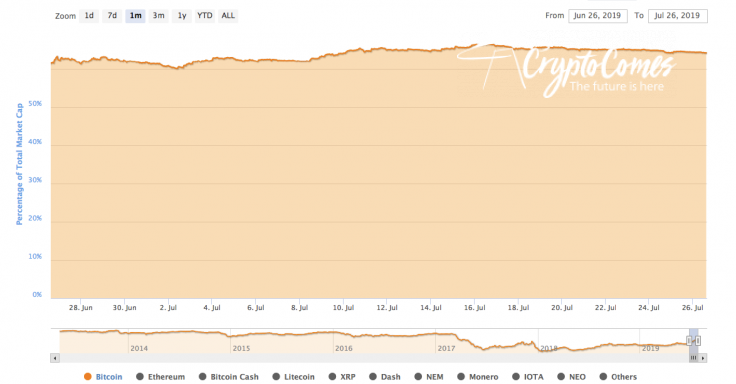
July 26, the cryptocurrency market has switched from green to red once again. However, there are few exceptions from the rule. The rates of Bitcoin Cash and EOS have increased by 2% and 1% respectively. The biggest loser is Bitcoin SV, whose price has dropped by 2.58% over the last 24 hours. Bitcoin dominance index has almost not changed since yesterday and now constitutes 64.4%.
Now, let’s get to charts of the top coins.
BTC/USD
Our earlier Bitcoin price prediction came true, and the leading cryptocurrency plummeted even below $9,900.
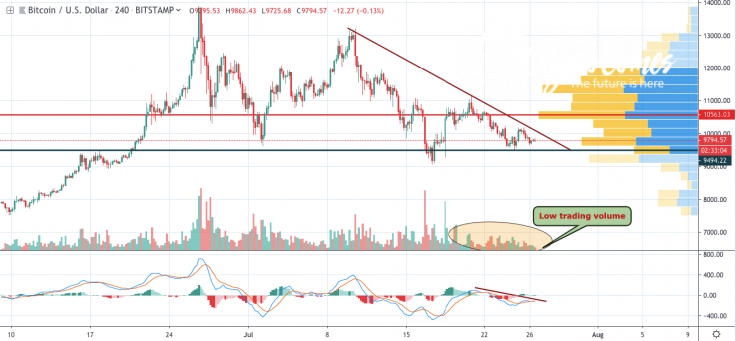
On the 4H chart, Bitcoin remains bearish mostly due to the absence of trading volume. Traders may think about a trend change only if volume index returns to its high levels.
Regarding the nearest price prediction, BTC will go down to the support at $9,500. The falling MACD indicator confirms such price movements.

The price of BTC is trading at $9,799 at the time of writing.
ETH/USD
Our Ethereum price prediction did not justify itself, as ETH bounced back from the $212 mark and reached the resistance at $220.
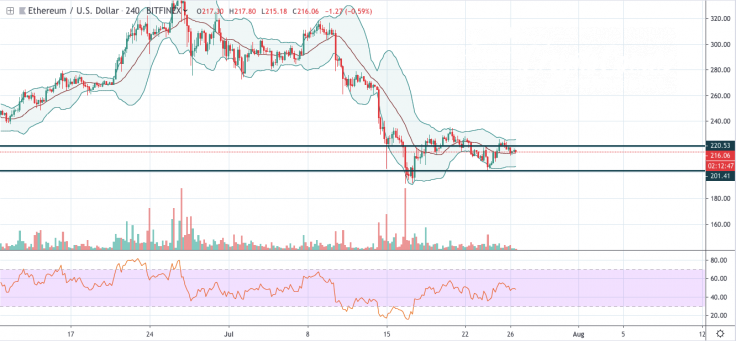
The leading altcoin reached the level of $220, however, could not fix it and dropped to $215, where it is located now. The trading volume of Ethereum is also low, and the coin is not likely to soar above $220 shortly. Traders might expect the coin trading sideways if volume remains at the same positions.
The price of ETH is trading at $216.06 at the time of writing.
XRP/USD
Ripple is struggling to get out from the bearish mood, as it is the only coin out of the top 3, whose rate has almost not changed since yesterday.
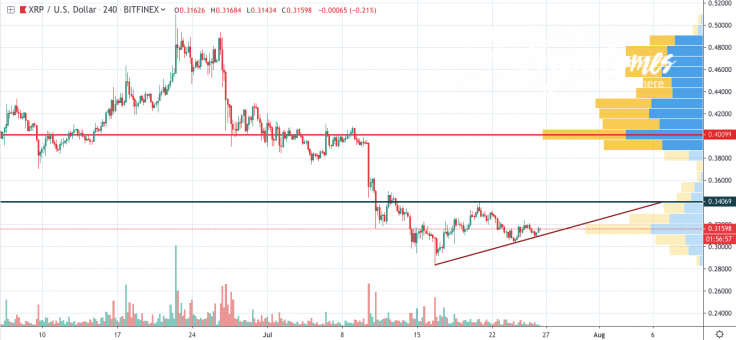
Despite the relatively low trading volume, Ripple might change the trend soon. On the 4H chart, XRP is forming the Triangle pattern with the endpoint at $0.34. This level may be achieved in the first days of August if the volume remains unchanged.
The price of XRP is trading at $0.3159 at the time of writing.


