According to a prominent expert, new peaks of correlation between Bitcoin (BTC) and stock price dynamics can be explained by the evolution of crypto trading instruments.
The ability to hedge
Biser Dimitrov has shared statistics from the Coinmetrics on-chain research team. The chart from his tweet showcases the correlation between daily returns of Bitcoin (BTC) and S&P500 investments. Two lines refer to a 30-day rolling correlation (blue line) and a 90-day rolling correlation (orange line).
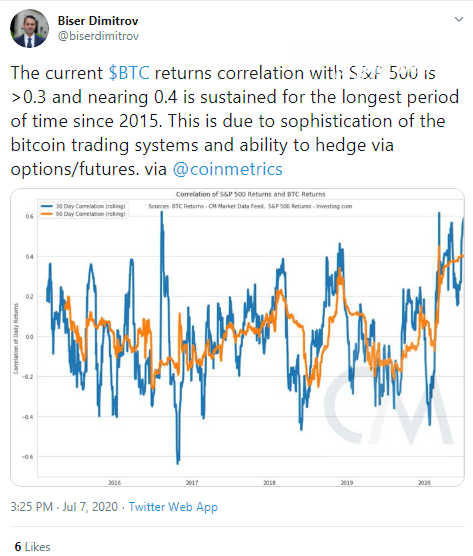
According to the statistics, the correlation between Bitcoin (BTC) and the S&P500 returns is inching closer to a three-year high. It has already broken above 0.3 and is approaching 0.4. This growth in the correlation is the most sustainable that has been seen since 2015.
Mr. Dimitrov believes that this growth can be explained by the maturation of Bitcoin (BTC) trading systems. Also, the flagship cryptocurrency demonstrates the ability to hedge market volatility with very popular futures and options trading platforms.
Also, Mr. Dimitrov outlined that today's market needs an 'asymmetric, non-correlated assets class'. For some reasons, Gold can be considered as belonging to such a class, but it is 'not enough', the expert concluded.
When correlation surges?
The problem of correlation between the Bitcoin (BTC) price (or net crypto market capitalization) and stock price movements has been widely discussed in blockchain and financial communities. One of the most holistic theories was delivered by analyst Charles Edwards of Capriole Investments.
According to his 'Amygdala Overdrive Relationship' law, Bitcoin (BTC) and stocks see strong correlation only in periods of either Extreme Greed and Extreme Fear market sentiment.
This thesis managed to explain the 'decoupling' process that became the holy grail of market analysis in Q2, 2020.
At press time, the Crypto Fear&Greed Index is in the 'Fear' zone, with 43 points out of 100.