A bullish mood remains on the cryptocurrency market as all Top 10 coins remain in the green zone. The biggest gainer is Polkadot (DOT), whose rate has risen by 13.72% over the last day.
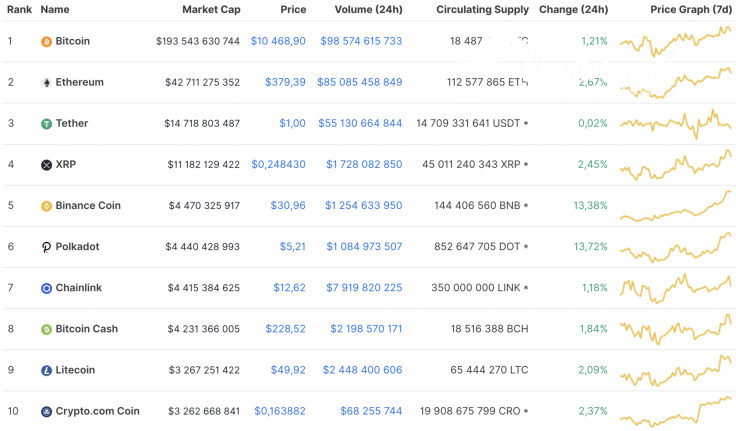
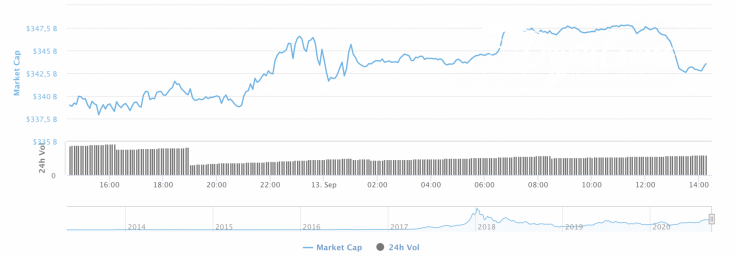
The cryptocurrency market capitalization keeps rising; the index has grown by $7 bln since yesterday and is now at $345 bln.
The relevant yearn.finance data looks the following way today:
-
Name: yearn.finance
-
Ticker: YFI
-
Market Cap: $1,135,589,102
-
Price: $37,894.10
-
Volume (24h): $800,312,264
-
Change (24h): -0.16%
The data is relevant at press time.
YFI/USD: Has the expected correction started yet?
Yearn.finance (YFI) remains the most expensive cryptocurrency at the moment. Even though the rate of the DeFi token is unchanged since yesterday, the price has risen +53% over the last week.
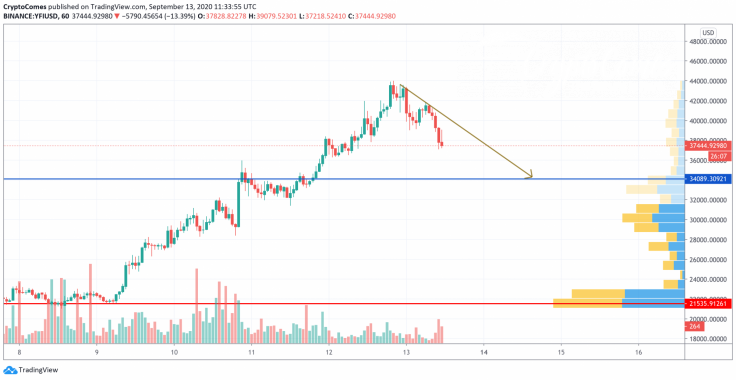
On the hourly chart, yearn.finance (YFI) has entered the correction phase. However, it is too early to consider that a trend change has taken place. The selling volume is increasing, and there is not almost no liquidity at the current level, which means that bears may push the price of the coin to the nearest support at $34,000.
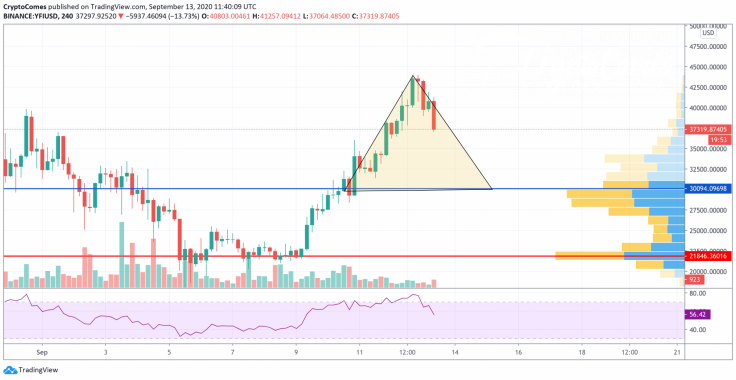
On the 4H time frame, the situation is also bearish. Buyers are running out of effort to keep the rate of the coin above $44,000. What's more, we may see the formation of the triangle pattern, which may bring the price to the crucial support of $30,000.
Thus, the RSI indicator has formed a bearish divergence which strengthens the position of sellers.
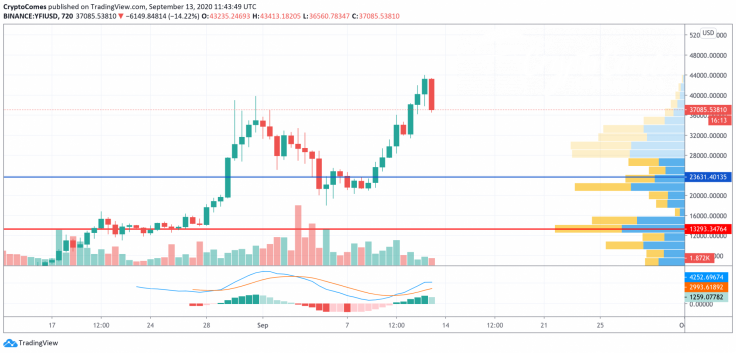
The daily chart is also considering a correction as the asset is already overbought. The lines of the MACD indicator are about to enter the red zone, which will confirm bears' presence. If that occurs, traders may expect yearn.finance (YFI) trading at around $23,000-$25,000 shortly.
YFI is trading at $37,074 at press time.


