The cryptocurrency market has switched to red except for Crypto.com Coin (CRO), which is the only crypto from the Top 10 list that is being pressured by bears.
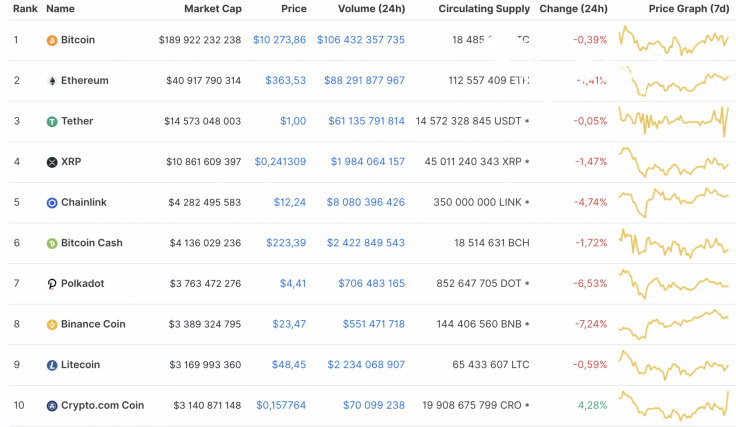
The main data for Chainlink (LINK), yearn.finance (YFI) and Polkadot (DOT) today:
|
Name |
Ticker |
Market Cap |
Price |
Volume (24h) |
Change (24h) |
|
Chainlink |
LINK |
$4,282,495,583 | $12.24 | $8,080,396,426 | -4.74% |
|
yearn.finance |
YFI |
$972,639,859 | $32,456.57 | $682,275,152 | 8.30% |
|
Polkadot |
DOT |
$3,763,472,276 | $4.41 | $706,483,165 | -6.53% |
LINK/USD
Chainlink (LINK) is the main loser out of the Top 3 cryptocurrencies. The rate of the altcoin has declined by almost 5% over the previous 24 hours.
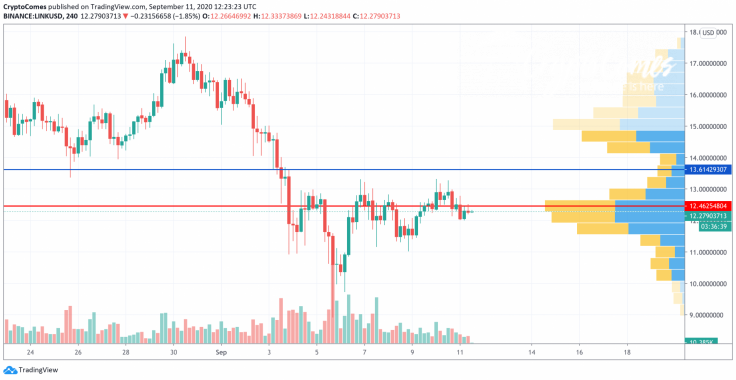
On the 4H time frame, Chainlink (LINK) is facing a correction phase after a drop from $17.80. From the technical point of view, the drop has not finished yet; however, bears need more energy to push the rate deeper.
The low selling volume confirms that a drop from current prices is unlikely to occur. In this case, one might expect a short-term rise to the liquidity zone at $13.60.
Chainlink is trading at $12.25 at press time.
YFI/USD
Yearn.finance (YFI) is the only gainer from our list. The price of the most expensive cryptocurrency has increased by 8.30% since yesterday.
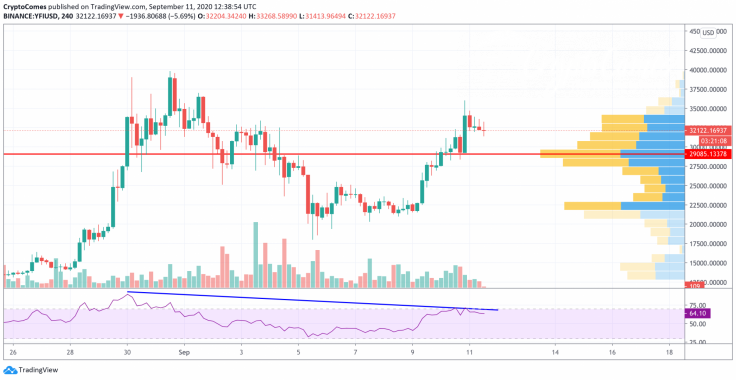
Despite the growth, yearn.finance (YFI) is also about to face a short-correction as bears have seized the initiative based on the low trading volume. Thus, there is a bearish divergence on the RSI indicator, which confirms a possible price decrease. However, one should consider it a correction to grab liquidity for a further rise. To sum up, sellers may get the rate of the token to $29,000 shortly.
YFI is trading at $32.132 at press time.
DOT/USD
Polkadot (DOT) is the main loser today. The price of the altcoin has decreased by 6.53% over the last day.
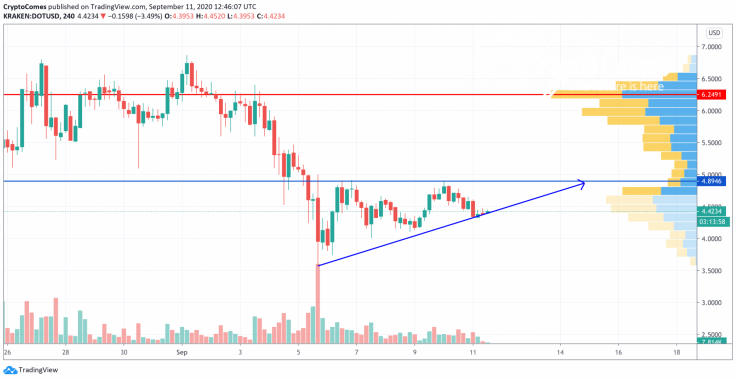
Even though Polkadot (DOT) is bearish today, its short-term perspective is bullish. The token has bounced off the support at $3.60 and is currently gaining efforts for a further rise. The high liquidity above supports ongoing growth that may lead the price to the nearest resistance at $4.89 by mid-September.
DOT is trading at $4.44 at press time.


