Bulls keep pushing the rates of most of the coins to previously reached levels, however, not all assets are in the green zone. XRP has gone down by 3.20% over the last day.
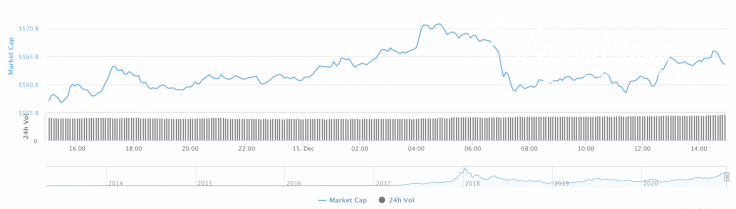
The total market capitalization has also risen by $6 billion and now stands at $563 billion.
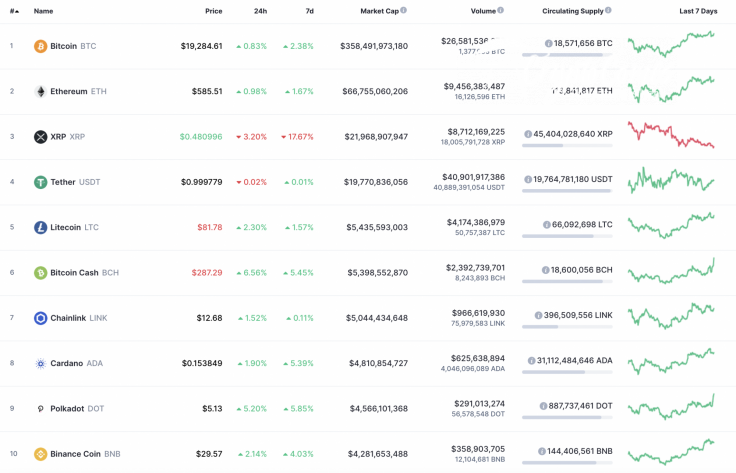
The relevant data for XRP is looking the following way:
-
Name: XRP
-
Ticker: XRP
-
Market Cap: $21,866,331,893
-
Price: $0.481821
-
Volume (24h): $8,659,235,232
-
Change (24h): -3.13%
The data is relevant at press time.
XRP/USD: Have bulls seized the initiative in the long-term perspective?
The hourly XRP price chart looks less optimistic than the Ethereum (ETH) chart. Yesterday the pair barely managed to hold above the psychological level of $0.50, and today it was unable to overcome the resistance of the EMA55 moving average.
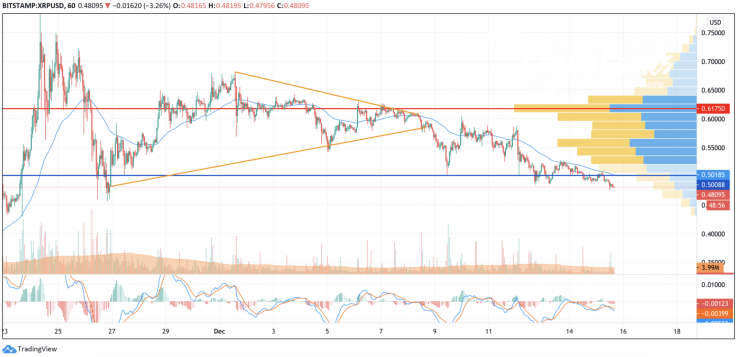
From the beginning of the month, sellers have completely controlled the market and have not allowed the pair to gain a foothold above the level of average prices. If bears intensify the onslaught, they will push through the strong support of $0.50 and roll back the price to the $0.45 mark.
The hype on the cryptocurrency market caused by a sudden breakout of the cryptocurrency flagship to a new annual high could trigger a spike in XRP price volatility and a rise in the area of the POC line ($0.619).
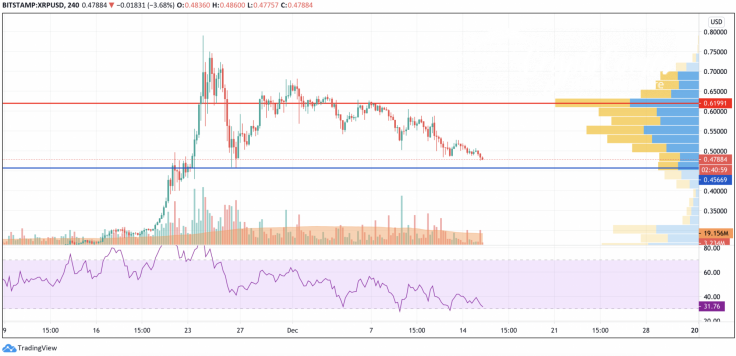
On the 4H chart, XRP is about to touch the local support soon at $0.4566. There is lilttle chance that it will be broken for the first time as the value of the RSI indicator is already located on the verge of the oversold zone. Thus, there is almost no liquidity in the area below $0.45.
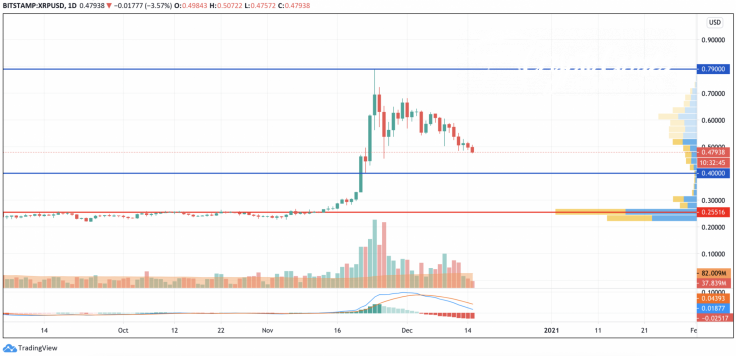
On the daily chart, the bearish scenario remains relevant as there is no buyer pressure based on the trading volume. The ongoing drop may continue to the closest support level at $0.40, where bulls may seize the initiative in the short-term perspective. If buyers do not hold that level, the next one is around $0.25 where most of the liquidity is focused.
XRP is trading at $0.4779 at press time.


