
The new week has started with a correction on the cryptocurrency market as all Top 10 coins are in the red zone.
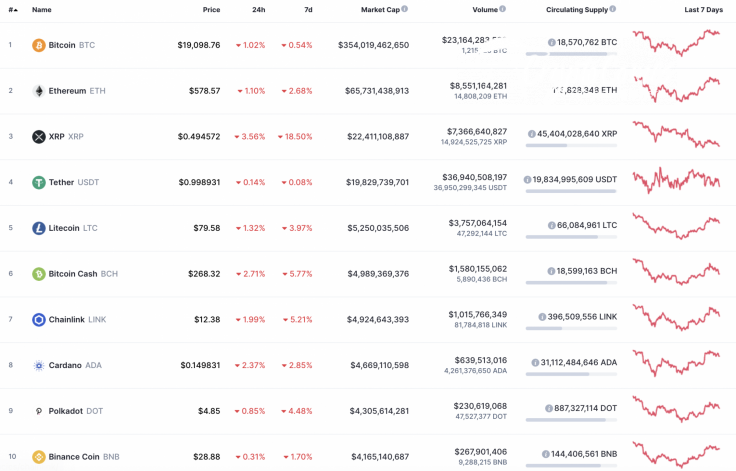
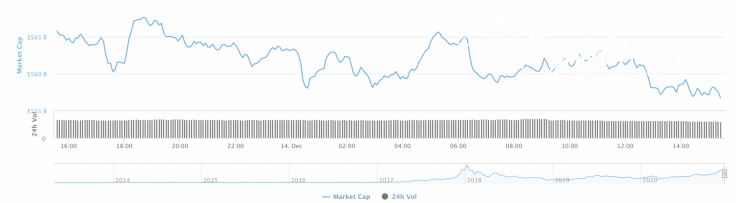
The cryptocurrency market capitalization has also been affected by the short-term drop. The index has gone down by almost $10 billion over the last day and now sits at $556 billion.
The relevant data for Bitcoin today:
-
Name: Bitcoin
-
Ticker: BTC
-
Market Cap: $354,435,183,628
-
Price: $19,120.63
-
Volume (24h): $23,119,782,924
-
Change (24h): -0.96%
The data is relevant at press time.
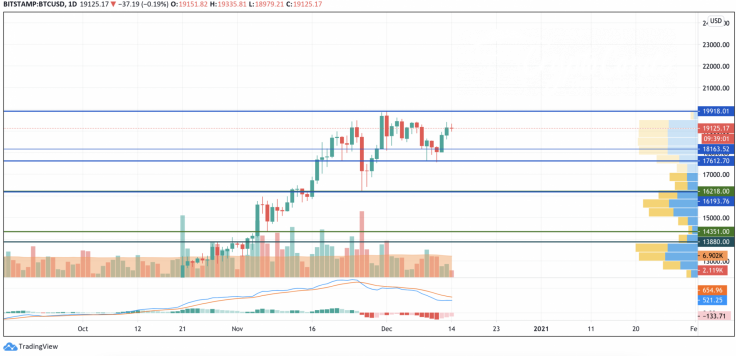
BTC/USD: Has the short-term trend ended yet?
Over the weekend, the Bitcoin price overcame the resistance of $18,800 and returned to the POC line, near which it was in a narrowing sideways channel at the beginning of this month.
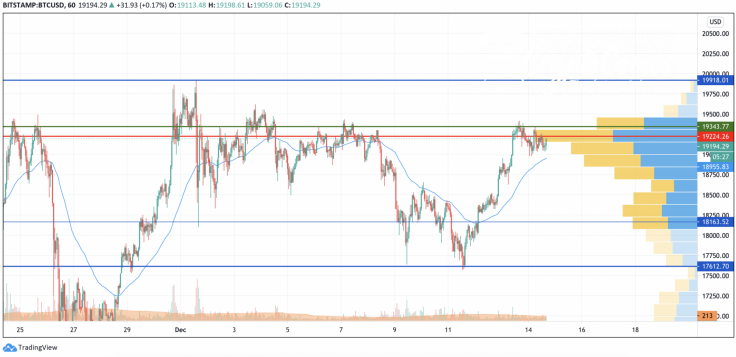
At the end of the week, the volume of purchases did not grow much and remained at an average level. If the pair consolidates in the area of the Volume Profile indicator line, buyers will try to break through the resistance of the 100% fibo level ($19,666) once again.

The target level of the bulls is the ceiling at around $20,000. A break above this mark will be a new milestone in the history of Bitcoin (BTC).
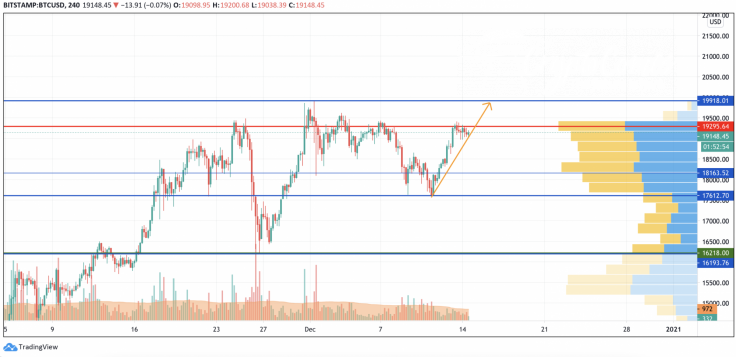
On the 4H chart, Bitcoin (BTC) remains bullish despite the drop from $19,400. The selling volume is low, which makes it difficult for bears to fix below $18,000. Thus, most of the liquidity is located above $19,200. In this case, there is a high chance of seeing $19,500 this week.
On the bigger time frame, buyers are also dominating according to the last two candles. Thus, the lines of the MACD indicator are about to switch to green, which will confirm the rising potential to the resistance at $19,900.
Bitcoin is trading at $19,085 at press time.


