The long-term correction might have started on the cryptocurrency market as all Top 10 coins are in the red zone. Chainlink (LINK) is the main loser among them, declining by 5.42%.
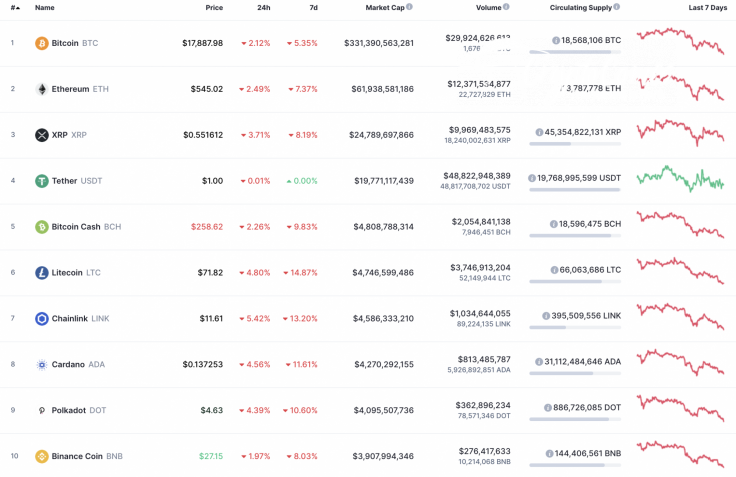
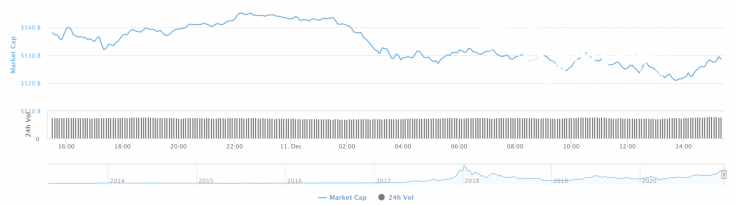
Meanwhile, the cryptocurrency market capitalization has lost $10 billion and is now at $528 billion.
The relevant Bitcoin data today:
-
Name: Bitcoin
-
Ticker: BTC
-
Market Cap: $332,211,862,422
-
Price: $17,891.53
-
Volume (24h): $28,609,577,426
-
Change (24h): -2.01%
The data is relevant at press time.
BTC/USD: Have bears seized the initiative in the long-term perspective?
Yesterday, buyers tried several times to break through the resistance of the hourly moving average EMA55, but each time the bears pushed the pair back below the average price level.
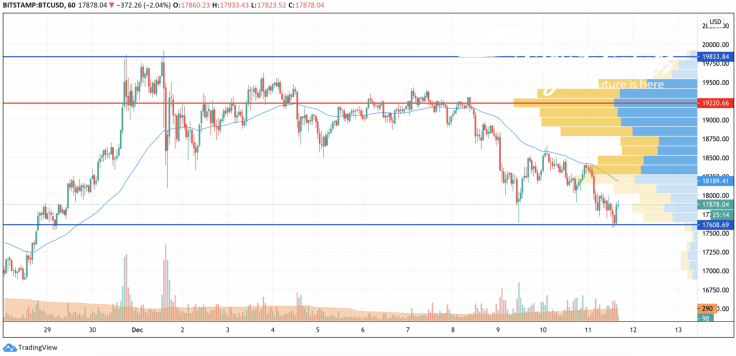
Tonight, the Bitcoin (BTC) price has rolled back to the monthly low zone and is trying to find support around the $17,600 mark. If buyers are able to form a bullish momentum, they may retrace the pair above the EMA55.
If the bears push through the strong support level of $17,600, then, on the weekend, the pair will roll back to the uptrend line (to the area of $17,000).
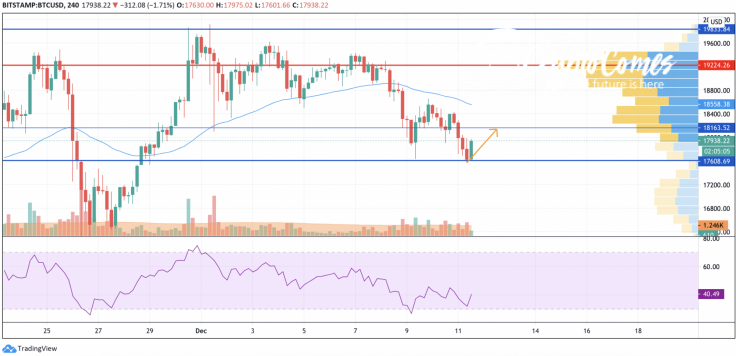
On the 4H chart, Bitcoin (BTC) is about to show a short-term bounce back before a more profound decline. The high possibility of a price rise is confirmed by the bullish divergence on the RSI indicator and low liquidity below $17,600. This means that sellers have low chances of keeping the drop from current levels. In this case, the growth may last to the mark of around $18,100.
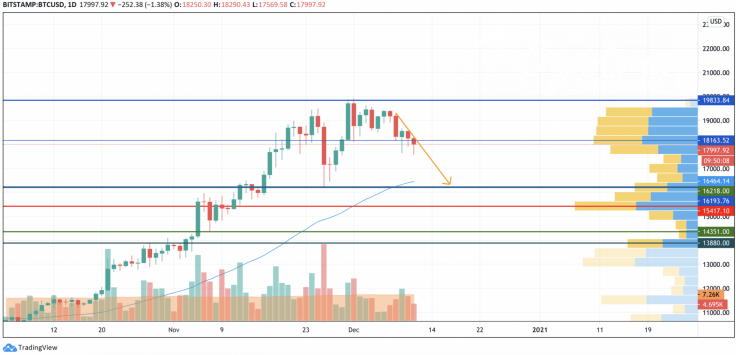
On the bigger chart, the situation is more bearish as there is no pressure from bulls based on the trading volume and liquidity. That is why the more likely scenario is an ongoing drop to the closest vital support at $16.20. Such price action is relevant until the end of the year.
Bitcoin is trading at $17,996 at press time.


