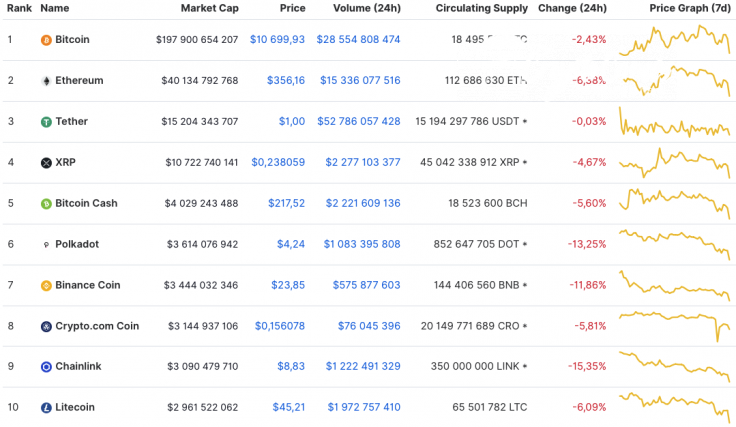
Monday has begun with a bearish wave on the cryptocurrency market as all Top 10 coins have returned to red. The main losers are Chainlink (LINK) and Polkadot (DOT), whose rates have declined by 15.35% and 13.25% respectively.
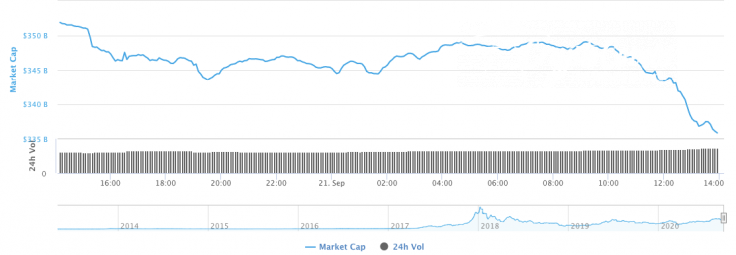
The market drop has affected the total capitalization index, which has lost $10 bln since yesterday and now stands at $339 bln.
The relevant data for XRP is looking the following way:
-
Name: XRP
-
Ticker: XRP
-
Market Cap: $10,762,384,126
-
Price: $0.238939
-
Volume (24h): $2,283,280,209
-
Change (24h): -4.31%
The data is relevant at press time.
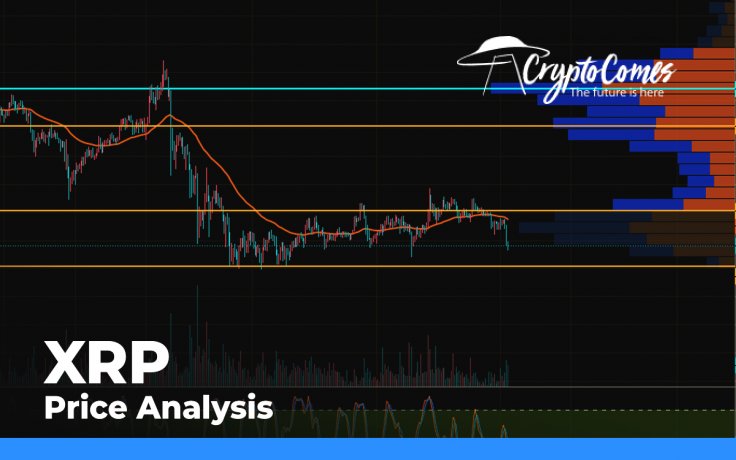
XRP/USD: Can traders expect $0.20 in the short-term scenario?
On Sunday, sellers pushed through the 2-hour EMA55 and the XRP price rolled back to the $0.242 mark. However, sales were below average and buyers are trying to recover the pair tonight.
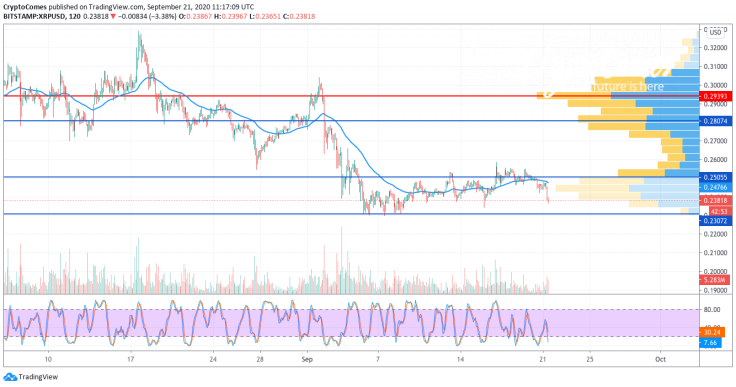
On the 2H time frame, the Stoch RSI indicator lines in the overbought zone formed a signal for a decline. It is highly probable that, in the first half of this week, the decline will continue to the support at $0.230.
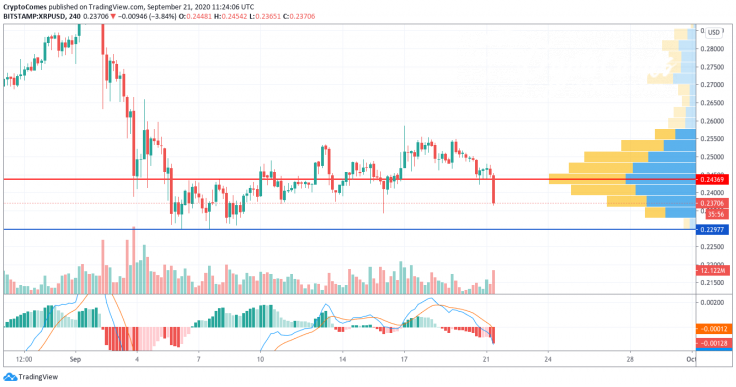
On the bigger chart, XRP is trading in the short-term bearish trend. The drop is not about to finish soon, as the selling volume keeps increasing.
Thus, the lines of the MACD indicator are already in the "short" zone and there are no signals of a possible trend change. All in all, there is a high chance of seeing XRP at the support of $0.23 by the end of the week.
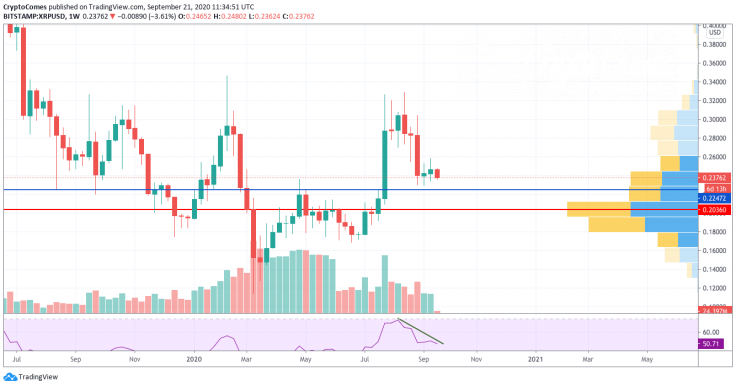
On the weekly time frame, the situation is also bearish as XRP has not finished the correction wave before continued growth. The bearish divergence on the RSI indicator confirms an ongoing decline. Analyzing the liquidity, most of it is focused in the range of $0.19-$0.22. In this regard, buyers are likely to show resistance at around $0.2250. If the trading volume increases, one may expect a potential reversal.
XRP is trading at $0.2369 at press time.


