The weekend has begun with a trend change on the cryptocurrency market. Almost all of the Top 10 coins are in the red zone except for Bitcoin (BTC), whose rate has risen by 0.03% since yesterday.

The key Bitcoin statistics for today:
|
Name |
Ticker |
Market Cap |
Price |
Volume (24h) |
Change (24h) |
|
Bitcoin |
BTC |
$203,308,910,479 | $10,993.42 | $27,054,361,900 | 0.03% |
|
Ethereum |
ETH |
$43,127,086,504 | $382.81 | $14,029,468,920 | -1.32% |
|
XRP |
XRP |
$11,249,789,779 | $0.249760 | $2,078,752,497 | -1.76% |
BTC/USD
The current week for Bitcoin has been more positive than the previous one, as the price of the chief crypto has gone up by almost 7% over the last seven days.
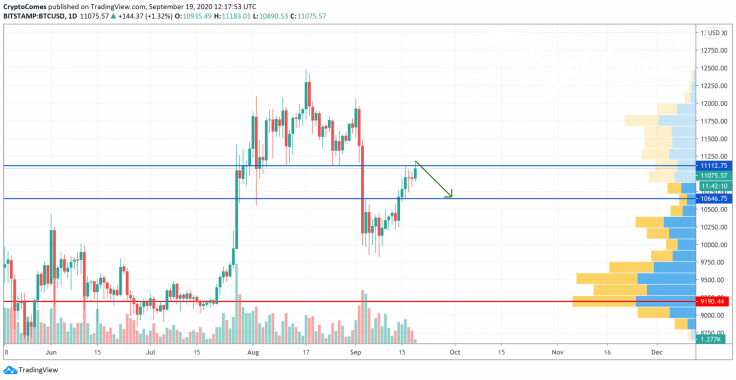
On the daily chart, Bitcoin (BTC) has reached the resistance level at $11,200. The short-term rise started from $10,000 and is about to finish as the trading volume is not enough to hold the ongoing growth. The same is applied to the liquidity, which is in the high area of $9,500. In this case, traders may expect a price drop of Bitcoin (BTC) next week to $10,000 or even below this crucial mark.
Bitcoin is trading at $11,073 at press time.
ETH/USD
Ethereum (ETH) has also been bullish for the past week; however, the rise was not so sharp. The rate of the leading altcoin has increased by 4% since the beginning of the week.
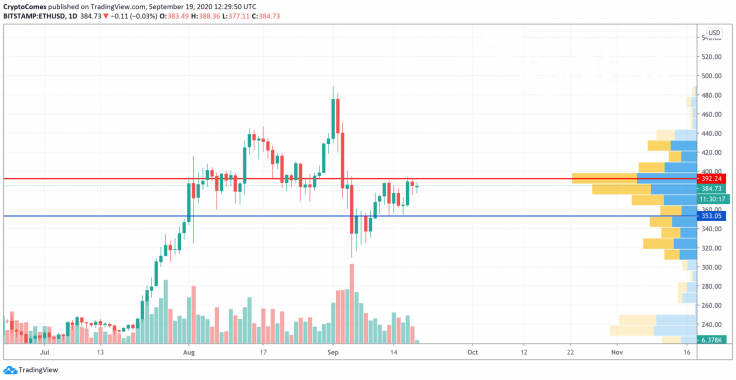
From the technical point of view, Ethereum (ETH) has already started the correction phase. It may retest the $400 mark one more time. However, the price is unlikely to fix above it as the bulls' power is not sufficient. That is why next week is expected to be bearish for Ethereum (ETH), with the nearest target of $353 serving a key support level.
Ethereum is trading at $384.68 at press time.
XRP/USD
XRP is not an exception to the rule as the altcoin has also located in the bullish zone this week. Growth by 3.89% has occurred.
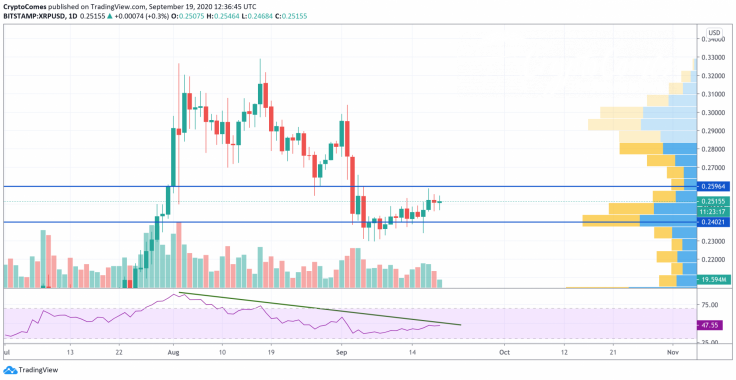
Analyzing the XRP chart, the rise might have come to an end as the buying volume is declining. Thus, there is a bearish divergence on the RSI indicator that supports a further drop.
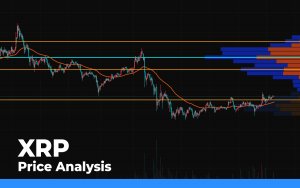
In case of a false breakout of the $0.2596 mark, the price decrease will lead XRP to the support at $0.24 soon.
XRP is trading at $0.2518 at press time.


