By the end of the week, the cryptocurrency market changed slightly as some of the coins have moved back into the green. In general terms however, there is no uncertainty as neither the bulls nor the bears dominate the market at the moment.
The total market capitalization has declined from the previous week and currently accounts for $361 billion.

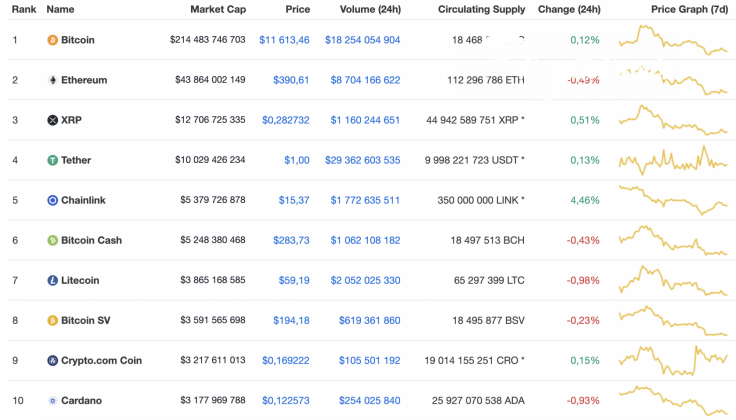
Below is the relevant data for XRP and how it's looking today:
-
Name: XRP
-
Ticker: XRP
-
Market Cap: $12,614,962,339
-
Price: $0.280691
-
Volume (24H): $1,152,946,211
-
Change (24H): 0.02%
The data was relevant at press time.
XRP/USD: Have Any Chances Left to Return to $0.30?
XRP is one of the biggest losers from last week. Even though the third most popular crypto has remained relatively unchanged since yesterday, the price change from the last 7 days has dropped 6.22%.
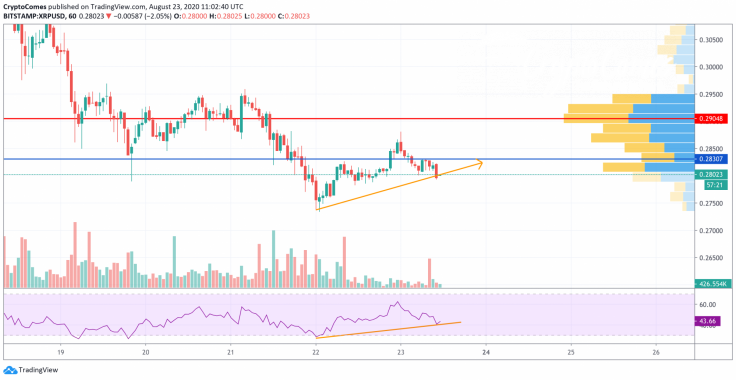
Looking at the hourly chart, XRP is bearish; however, a bounce back is likely to occur as the Relative Strength Index is forming a bullish divergence. The selling volume is declining, which means that bears are running out of strength.
The last but not least refers to the liquidity level, most of which is focused between the $0.2850-$0.29 range. That is why there is a high probability of seeing a short-term rise to $0.2830 soon.

Looking at the 4H chart, the situation is reversed. XRP has been trading within a falling channel since mid-August 2020. Based on the volume analysis, sellers are not going to give up easily. The bulls could not seize on the initiative after the altcoin bounces off its support level at $0.2734. This is why there is a high probability of seeing a retest of this level shortly.
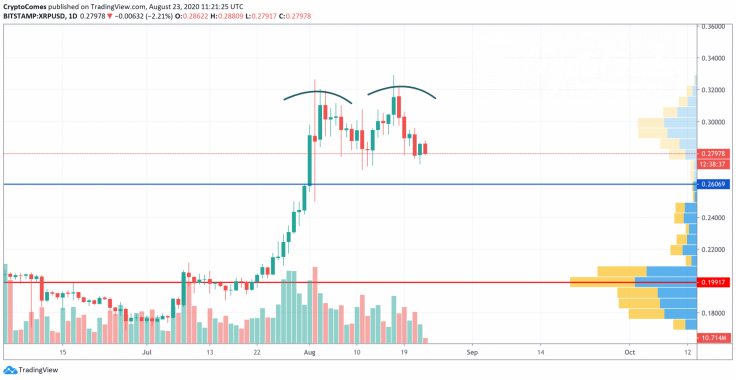
Looking at the daily chart, the bearish scenario is also relevant as the correction has not ended yet. The coin has formed a double top pattern, which confirms the ongoing pressure by the sellers. The decline may continue until the coin reaches the $0.26 mark, where the bulls may seize on the initiative.
At press time, XRP was trading at $0.2796.


