The cryptocurrency market has come back to the bearish zone as most of the coins are in the red. Bitcoin Cash (BCH) is the only altcoin from the Top 10 list that is falling under a bullish mood.
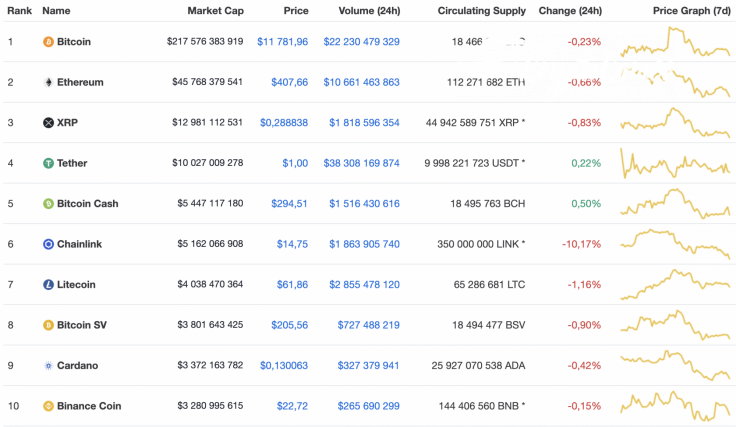
The key data for Bitcoin (BTC), Ethereum (ETH) and XRP today:
|
Name |
Ticker |
Market Cap |
Price |
Volume (24h) |
Change (24h) |
|
Bitcoin |
BTC |
$217,576,383,919 | $11,781,96 | $22,230,479,329 | -0.23% |
|
Ethereum |
ETH |
$45,768,379,541 | $407.66 | $10,661,463,863 | -0.66% |
|
XRP |
XRP |
$12,981,112,531 | $0.288838 | $1,818,596,354 | -0.83% |
BTC/USD
Buyers were trying to overcome the 2-hour EMA55 yesterday. In the evening, the price of Bitcoin (BTC) hit the EMA55 moving average curve and, by the end of the day, it could not break above it.
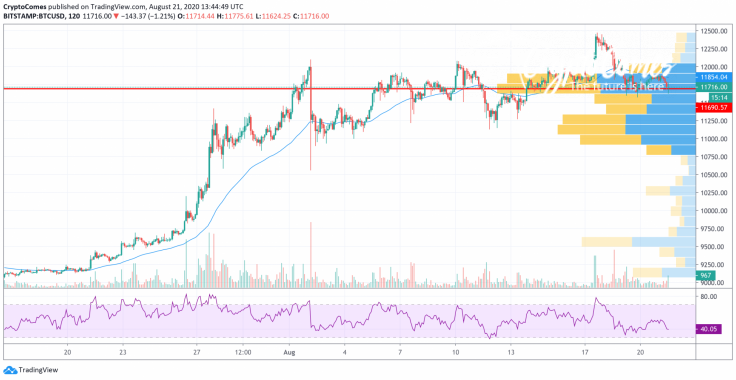
In the evening, trading volumes decreased and, by this morning, the pair lay in a narrow sideways range. One may consider that the bulls have not yet exhausted the limit of attempts to recover above the level of average prices.
It is possible that, after a pullback just below the POC line ($11,742), attempts to overcome the two-hour EMA55 could end in a breakout. However, if consolidation in a narrow range is delayed, then the subsequent pullback will be deeper than the support level of 50% Fibo ($11,394).
Bitcoin is trading at $11,730 at press time.
ETH/USD
A similar situation has developed with the Ethereum (ETH) price. Yesterday, buyers were unable to gain a foothold above the average price level. The pair managed to break through the resistance of the two-hour EMA55 several times, but declining trading volumes helped consolidate the pair below the EMA55 moving average.
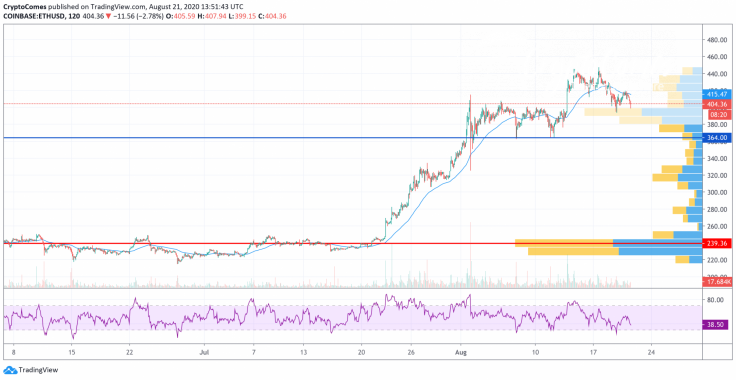
If buyers manage to form a strong bullish momentum today, then the price of Ethereum (ETH) could return to the zone of the annual high. If it is not possible to overcome the level of average prices, then a deep pullback to the support of $360 is possible.
Ethereum is trading at $404.01 at press time.
XRP/USD
Yesterday, buyers were able to recover to the area of average prices, but the recovery took place without support from large purchases. Thus, by this morning, the pair remained in a narrow sideways range on the POC line ($0.294).
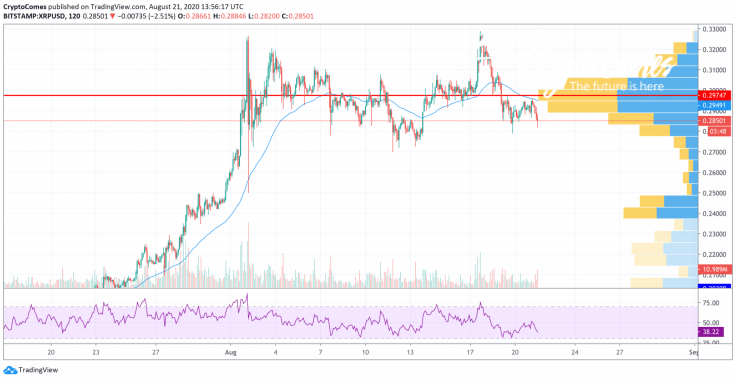
If the bulls are able to break through the two-hour EMA55 today, the pair will consolidate above the resistance of $0.310. If a bullish impulse is not formed, then on small volumes, the pair will gradually roll back below the support of $0.280.
XRP is trading at $0.2845 at press time.


