A correction has begun on the cryptocurrency market as all Top 10 coins are located in the red zone. The biggest loser is the recent top gainer, Chainlink (LINK), whose rate has declined by almost 6% since yesterday.
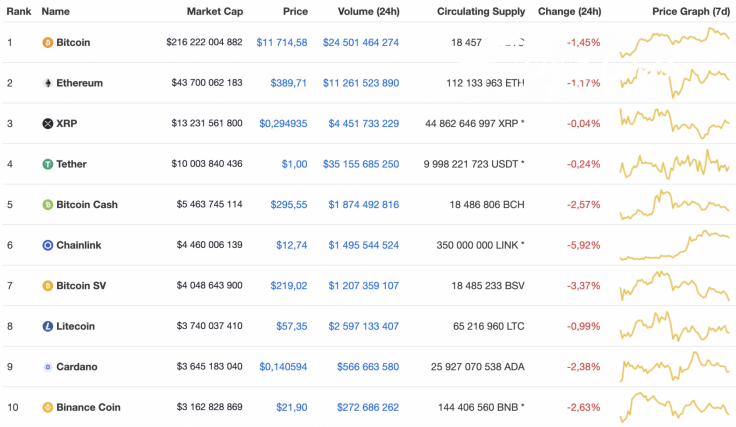
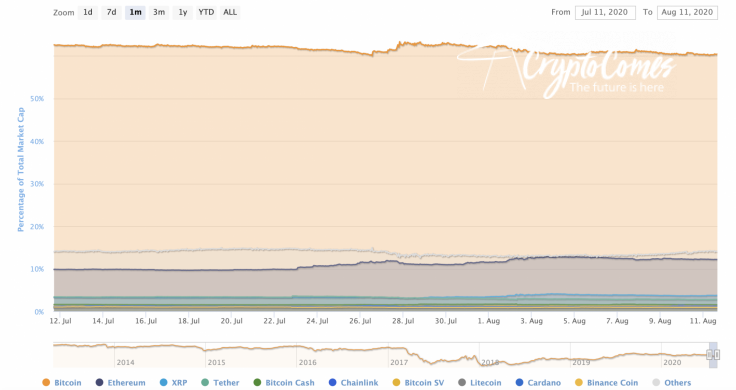
As some altcoins have lost much more than Bitcoin (BTC) has, the dominance rate of the main crypto has strengthened recently and currently makes up 60.5% of the market.
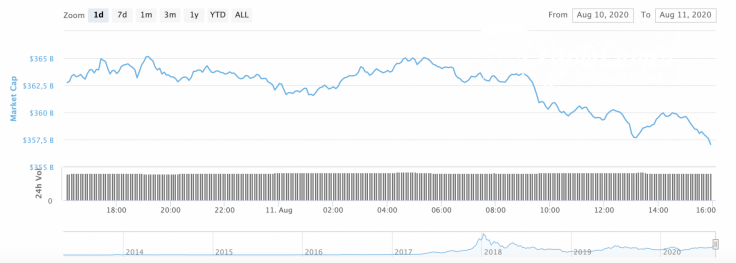
However, total market capitalization has declined by around $5 bln over the last 24 hours and is now at $357 bln.
The relevant data for Bitcoin today:
-
Name: Bitcoin
-
Ticker: BTC
-
Market Cap: $215,902,072,978
-
Price: $11,697.19
-
Volume (24h): $23,363,708,310
-
Change (24h): -1.41%
The data is relevant at press time.
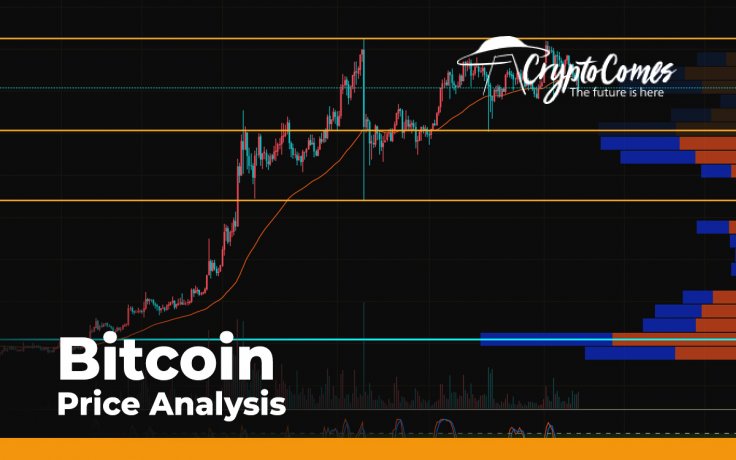
BTC/USD: How deep can the correction go?
Yesterday morning, buyers were unable to build up buying volumes and growth stopped at the daily high point of $12,080. The high zone of August 2019 remains, as before, out of reach for bulls.
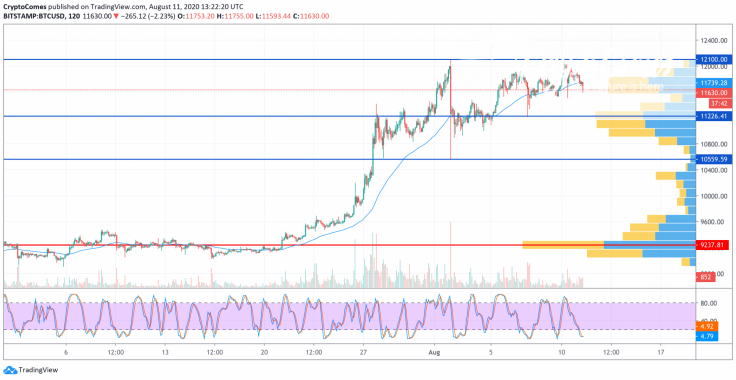
Sellers extinguished yesterday's attempt to break into the one-year high zone with a bearish impulse, which pushed the pair back to the support of $11,500.
However, Bitcoin (BTC) quickly bounced above the average price level, and today buyers are ready to try again to refresh the annual maximum. If buyers find support in the 2H EMA55 area, they may form another bullish impulse. If bears push through the level of average prices, the pair will return to the 50% fibo support ($11,394).
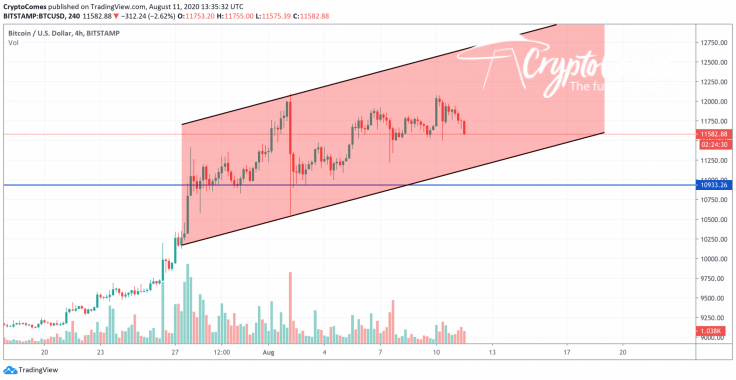
On the 4H time frame, the bearish mood is gaining steam as bulls are unable to hold the $11,500 level. The selling volume is high enough, which means that the ongoing drop is likely to continue. In this case, the levels at which a potential reversal might occur range from $11,000 to $11,200.
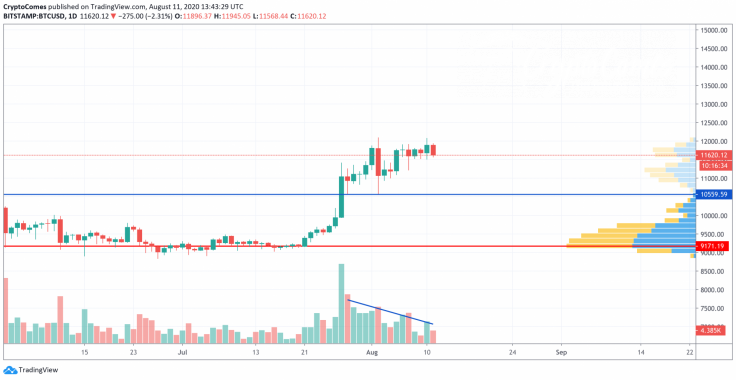
On the daily chart, the situation is also rather more bearish than bullish. The trading volume is going down slightly despite the fact that the trend remains bullish. Further, there is not high enough liquidity to hold the rate of Bitcoin (BTC). In this case, bears may drop the rate of the chief crypto to the support area of $10,500 before a further rise.
Bitcoin is trading at $11,621 at press time.


