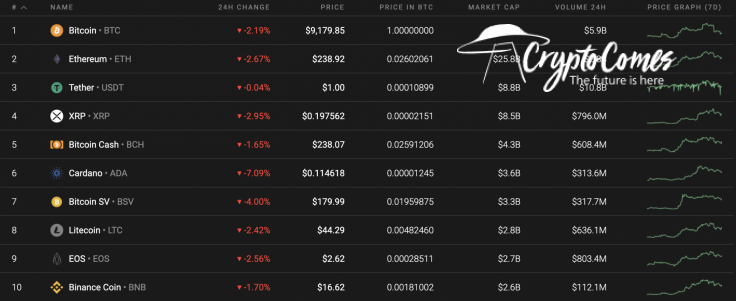
The cryptocurrency market has switched to red at the end of the week. All of the top 10 coins are in the red zone while the top loser is the recent gainer Cardano (ADA). Its price has gone down by 7.09% over the past day.
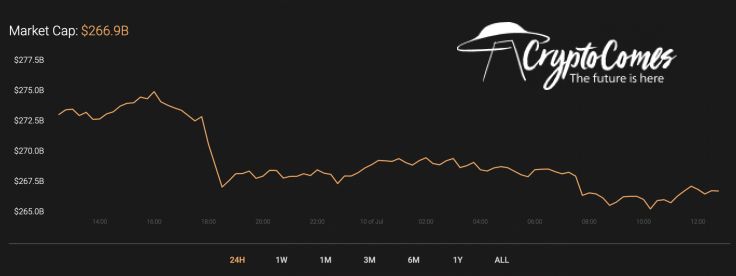
The market capitalization has also declined since yesterday. The loss has amounted to around $6 Bln. At the moment, the index is $266.9 Bln.
The relevant data for XRP is as follows.
-
Name: XRP
-
Ticker: XRP
-
Market Cap: $8,739,535,532
-
Price: $0.197469
-
Volume (24h): $1,520,074,738
-
Change (24h): -3.63%
The data is relevant at press time.
XRP/USD: Will there be a retest of $0.20 before a continued decline?
Yesterday morning, the price of XRP recovered to the POC line ($0.203) and tried to continue to grow to the resistance at $0.213. In the afternoon, buyers were able to set a new monthly maximum at $0.212 USD, after which fairly large sales volumes took the pair back to support at $0.20.
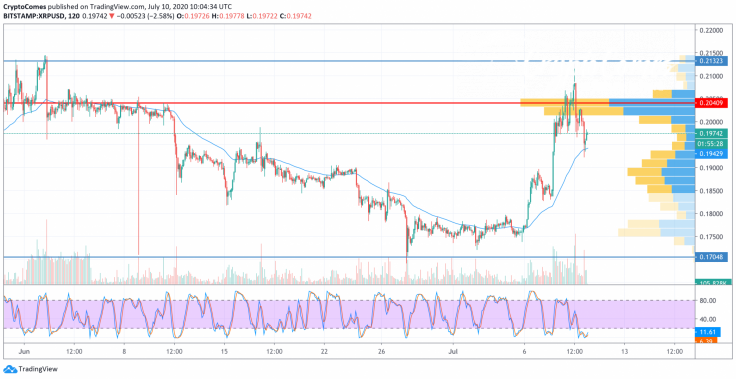
In the morning, the price might be still at the psychological mark of $0.20, but the pressure from the bears remains and today the pair could drop to the two-hour EMA55. Probably, at around $0.194, buyers will take advantage of the support of the average price level and will be able to suspend a further decline.
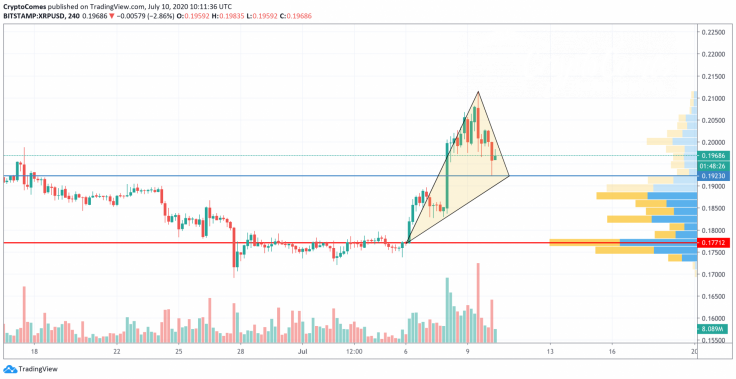
On the 4H time frame, the bearish mood prevails over the bullish one. At the moment, there is no reason for growth as the trading volume continues to decrease. Also, most of the liquidity is concentrated below the $0.19 mark. In this regard, traders might expect a continued drop to the first resistance at $0.1923. It might happen by the end of the week.
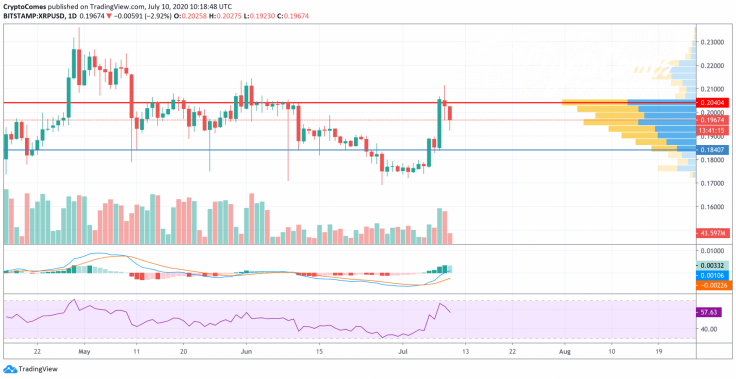
On the bigger chart, nothing positive has appeared yet. The bearish divergence on the RSI indicator confirms the ongoing seller pressure. In addition, the MACD indicator might change to red soon. Although the liquidity is quite high, the trading volume is not high enough to keep XRP at the current levels. Respectively, the most likely option is a drop to $0.1840 shortly.
XRP is trading at $0.1969 at press time.


