Despite the fact that most of the Top 10 coins are in the green zone, traders may have started fixing their positions as some cryptocurrencies are under the influence of a bearish mood.
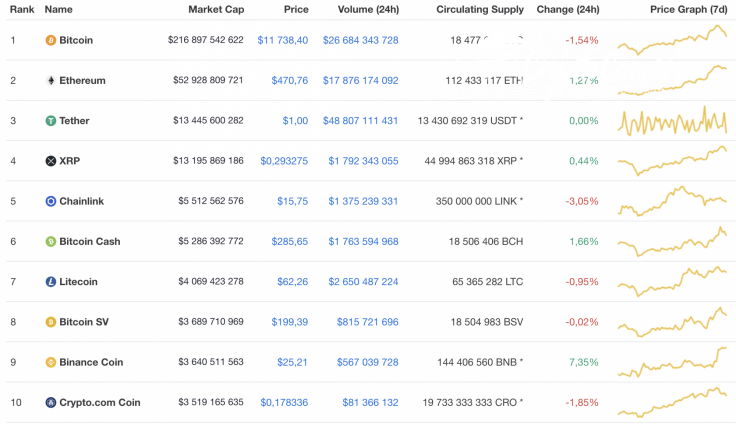
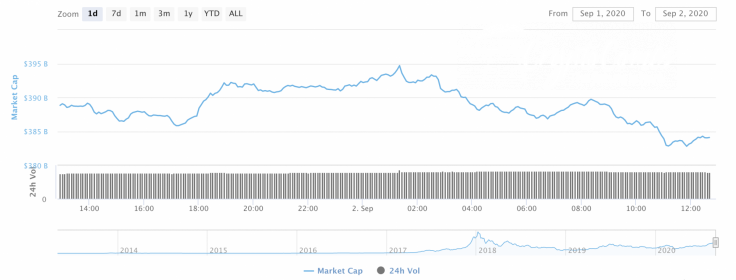
The decrease in the price of some coins has affected total capitalization, which has declined by $4 bln over the last day and is now at $384 bln.
The relevant data for TRON today:
-
Name: TRON
-
Ticker: TRX
-
Market Cap: $2,588,478,816
-
Price: $0.036122
-
Volume (24h): $3,045,645,638
-
Change (24h): 20.42%
The data is relevant at press time.
TRX/USD: Is the ongoing price blast the start of a new rally?
TRON (TRX) is the fastest growing coin out of the Top 10 cryptocurrencies. The rate has rocketed by 20% over just the last 24 hours, while over the last week there has been 57% growth.
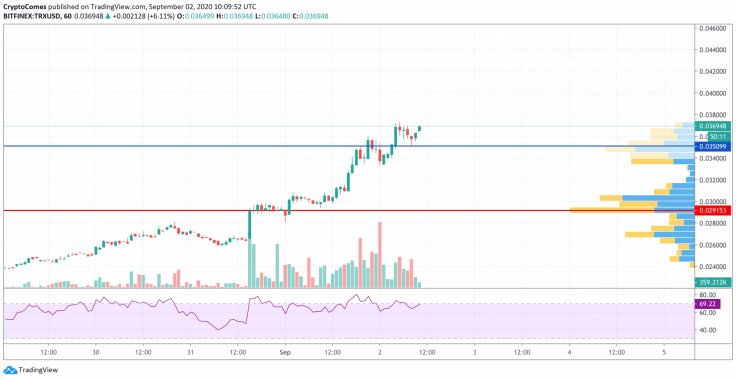
On the hourly chart, the correction has already started as bulls lack the effort to keep pushing the rate higher. It is confirmed by the low trading volume and liquidity level. In addition, the RSI indicator has almost reached the verge of the overbought zone. All in all, the short-term decline to the closest support at $0.035 is the most likely scenario.
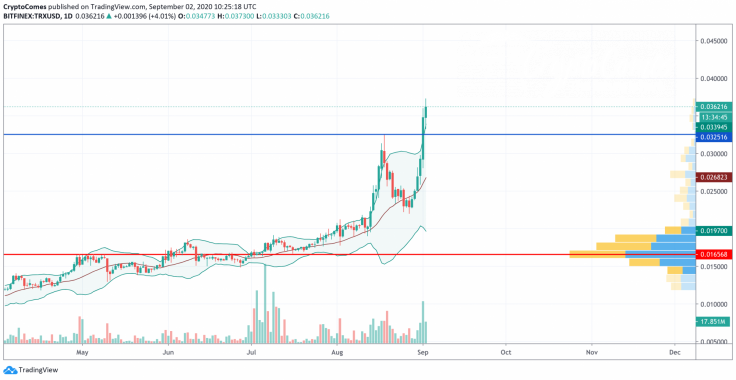
On the daily time frame, bears are also about to seize the initiative. The buying trading volume is declining, which considers a possible short-term decline.

Applying the Bollinger Bands indicator on the chart, TRX may test its basic line if the price goes below the support at $0.032. However, that will be part of a correction but not the start of a new bearish cycle.
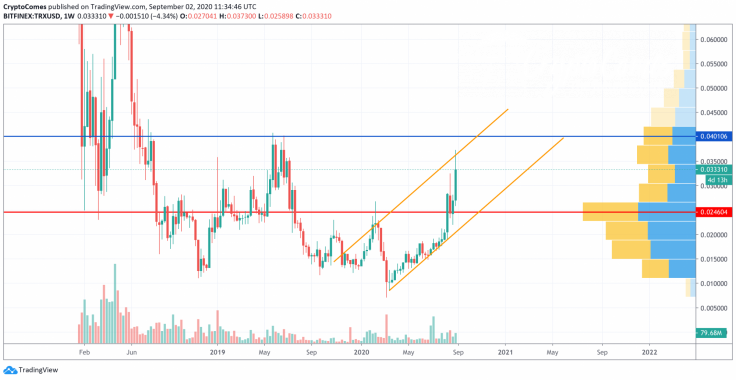
The situation on the weekly chart is the complete opposite. The rise has just begun after TRON (TRX) has left the accumulation phase. For this reason, the long-term scenario is bullish. If the crypto fixes above $0.03 and keeps trading around this level, buyers have high chances of reaching the next resistance at $0.04 in 2021 or even by the end of the current year.
TRX is trading at $0.03357 at press time.


