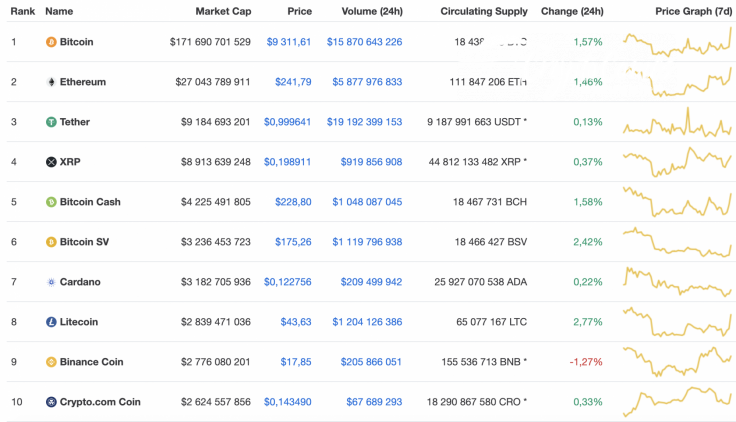
Bitcoin (BTC) is about to get out of the consolidation phase, rising by 1.57% over the last day. Meanwhile, altcoins have not kept up with the leading crypto as most of them have not shown such a rise. Moreover, Binance Coin (BNB) is even in the red zone, falling by 1.27%.
The key data for Chainlink (LINK), Syscoin (SYS) and Compound (COMP):
|
Name |
Ticker |
Market Cap |
Price |
Volume (24h) |
Change (24h) |
|
Chainlink |
LINK |
$2,607,442,456 |
$7.47 |
$743,125,065 |
-6.50% |
|
Syscoin |
SYS |
$74,005,450 |
$0.125271 |
$48,464,896 |
70.05% |
|
Compound |
COMP |
$412,794,134 |
$161.17 |
$55,729,137 |
-3.73% |
LINK/USD
Chainlink (LINK) is the main loser from our list and among the top 20 coins. The rate of altcoins has dropped by 6.50% over the last 24 hours.
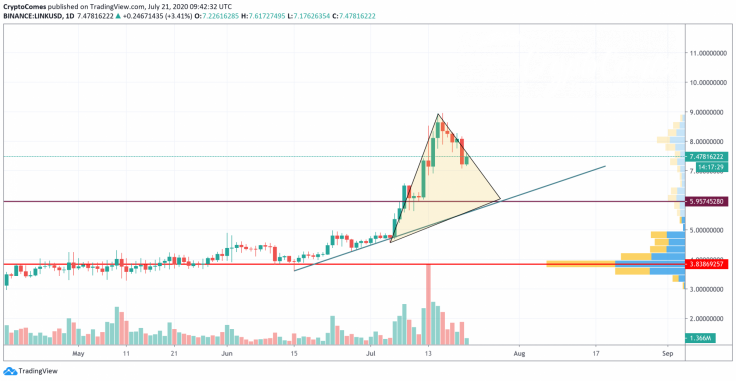
On the daily chart, Chainlink (LINK) has returned to the levels of July 14; however, a rise is unlikely to occur from the current area as the buying trading volume is still low.
Besides, liquidity is also at its lowest level, which means that there are no buying orders from bulls at the moment. The fall might continue until the altcoin reaches the bottom of the rising channel, forming a triangle pattern. In this regard, the support is at the $5.95 mark.
Chainlink is trading at $7.46 at press time.
COMP/USD
Compound (COMP) is also undergoing a bearish mood since yesterday. However, its decline is not so deep. The price drop has constituted 3.73%.
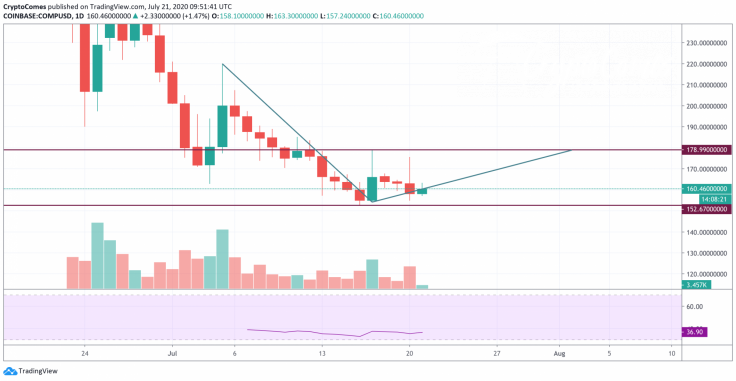
On the daily time frame, Compound (COMP) may have found its support at $152.67. The RSI indicator is forming a bullish divergence which considers bullish potential. Moreover, the selling trading volume is low, meaning that bears have run out of fuel to keep pushing the coin down. It is too early to consider a bullish wave; however, COMP has quite a good chance to achieve local resistance at $178.99 if the rise continues.
Compound is trading at $161.42 at press time.
SYS/USD
Syscoin (SYS) is our top gainer. The altcoin has blasted up by 70% over the last 24 hours. Such skyrocketing numbers might be the result of the accumulation period of the past few months.
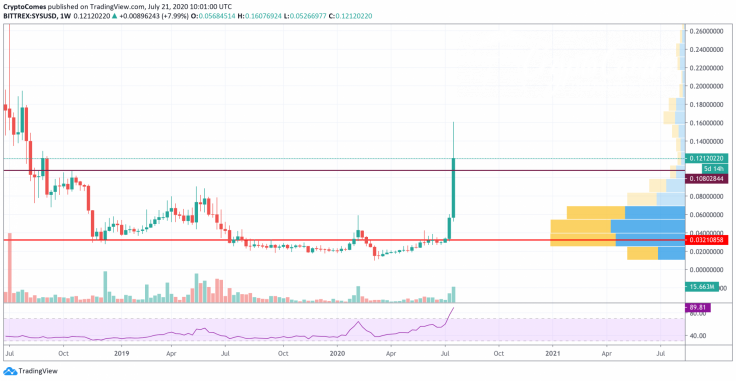
On the weekly chart, Syscoin (SYS) has come back to the positions of July 2018. The altcoin might have entered a bullish wave, but a correction is likely to occur soon. The more likely forecast is that bears may return the coin to the mirror level at $0.1080 to gain strength for a further rise.
Syscoin is trading at $0.1227 at press time.


