By mid-week, the cryptocurrency market is not as bullish as it was at the beginning. While Cardano (ADA) and Chainlink (LINK) have continued their growth, Binance Coin (BNB) and Litecoin (LTC) are in the red zone.
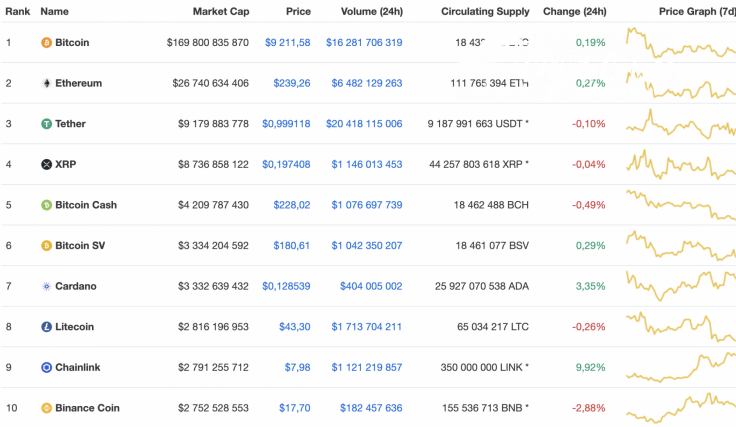
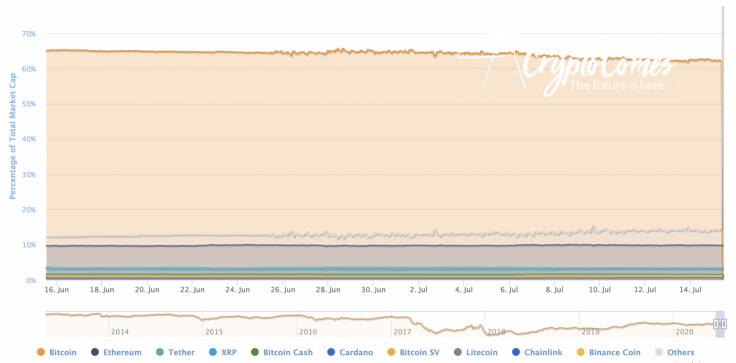
Meanwhile, the market share of Bitcoin (BTC) keeps declining slightly against the increasing dominance of altcoins. The current market share of the leading crypto is 62.4%.
The current Chainlink data are stacking up this way:
-
Name: Chainlink
-
Ticker: LINK
-
Market Cap: $2,798,396,057
-
Price: $8.00
-
Volume (24h): $1,117,010,597
-
Change (24h): 9.98%
The data are current at press time.
LINK/USD: Will the decline be as sharp as the growth?
Chainlink (LINK) is the top gainer of the top 10 coins. The altcoin has risen by almost 10% since yesterday, while the price change over the past week has been 29.40%.
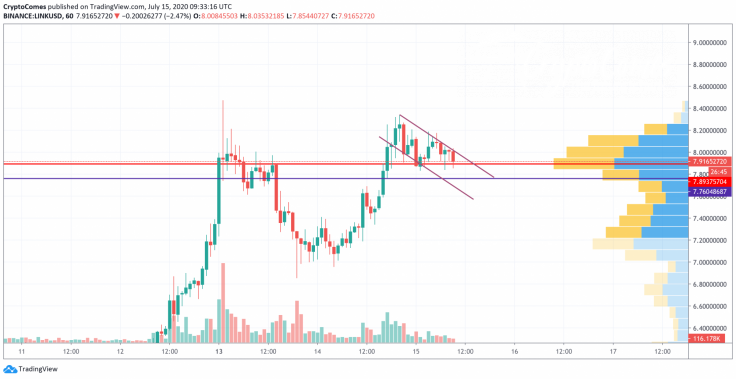
On the hourly chart, Chainlink (LINK) has begun a correction wave after it peaked at $8.33. At the moment, the altcoin is trading within the falling channel against a decreasing trading volume. If the situation remains the same, the drop might continue until LINK reaches $7.76. It may happen even by the end of the day.
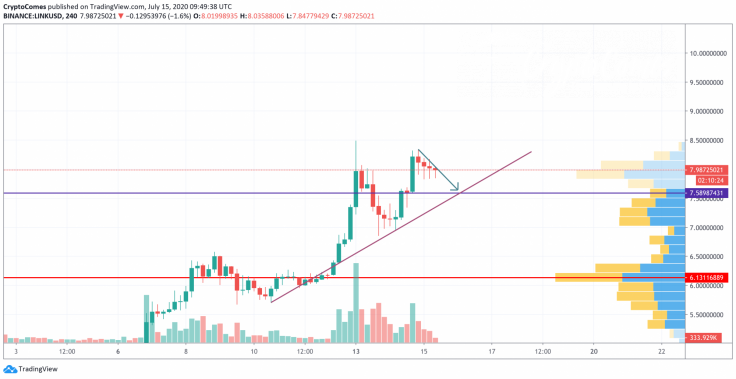
On the 4H chart, the bearish scenario is also relevant. A lack of liquidity and trading volume might push Chainlink (LINK) to the support of $7.58 within the next few days.
Thus, this mark also serves the bottom level of the rising channel. If bears manage to break, the growth forecast will be canceled out.
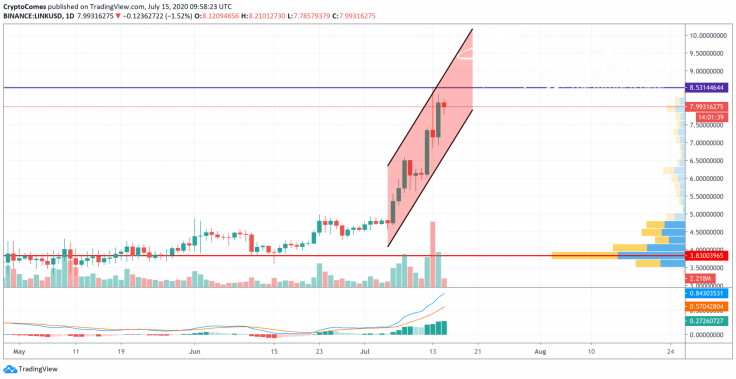
On the daily time frame, the picture is completely different. Bullish sentiments are strong enough to continue the growth. Thus, the lines of the MACD indicator are moving upward. If the trading volume remains at the same level or increases, there is a high chance that LINK will retest the local peak at $8.53 soon.
Chainlink is trading at $8 at press time.


