The situation has completely changed on the cryptocurrency market as all coins from the Top 10 list have switched to green. Mainly, Bitcoin Cash (BCH) is the top gainer, rising by almost 5% since yesterday.
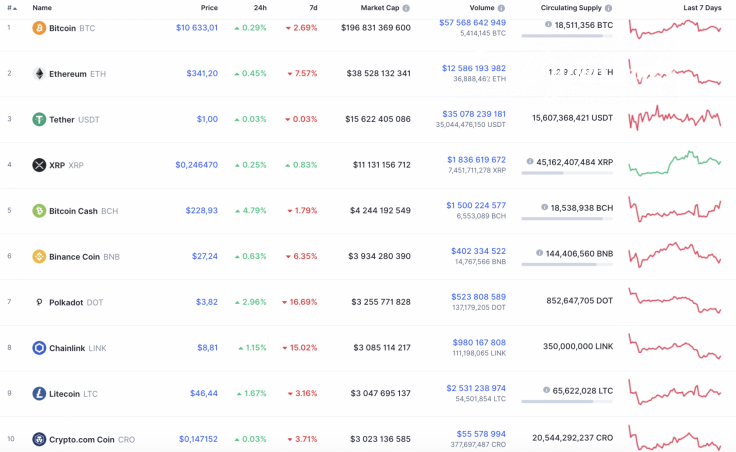
The main statistics for Chainlink (LINK), Bitcoin Cash (BCH) and Polkadot (DOT):
|
Name |
Ticker |
Market Cap |
Price |
Volume (24h) |
Change (24h) |
|
Bitcoin Cash |
BCH |
$4,244,192,549 | $228.93 | $1,500,224,577 | 4.79% |
|
Chainlink |
LINK |
$3,085,114,217 | $8.81 | $980,167,808 | 1.15% |
|
Polkadot |
DOT |
$3,255,771,828 | $3.82 | $523,808,589 | 2.96% |
BCH/USD
Bitcoin Cash (BCH) is the top gainer among the Top 10 coins. The rate of the Bitcoin fork has rocketed by 4.79% over the previous 24 hours.
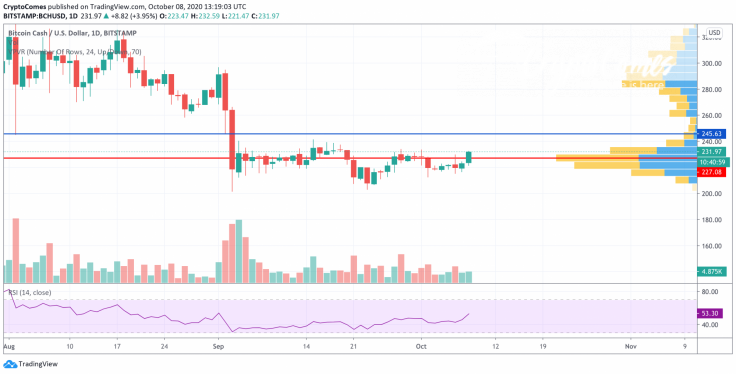
On the daily chart, Bitcoin Cash (BCH) has just got emerged from the consolidation phase that lasted for one month. In this case, the ongoing growth is unlikely to be a false rise.
The altcoin is going up with high liquidity support, as well as growing trading volume. Thus, the RSI indicator has formed a bullish divergence that supports the rise. In this regard, the resistance of $245.63 may be attained by mid-October.
Bitcoin Cash is trading at $231.68 at press time.
LINK/USD
Link is also located in the short-term bullish zone. However, the growth has not been so sharp. The price change has constituted +1.75% since yesterday.
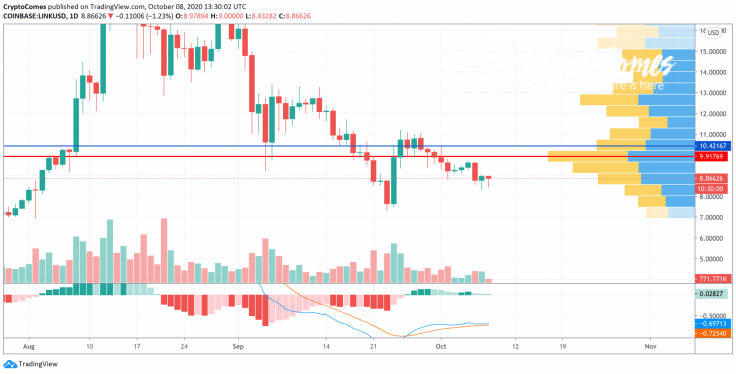
On the daily time frame, the volume is located at the lowest level, which means that sharp movement is likely soon. From the technical point of view, growth is more likely than a fall as most of the liquidity is focused around $10. In addition, the MACD is still located in the green zone.
Chainlink is trading at $8.87 at press time.
DOT/USD
Polkadot (DOT) has shown better price performance than Chainlink (LINK) but worse than Bitcoin Cash (BCH). The rate has increased by 2.96%.
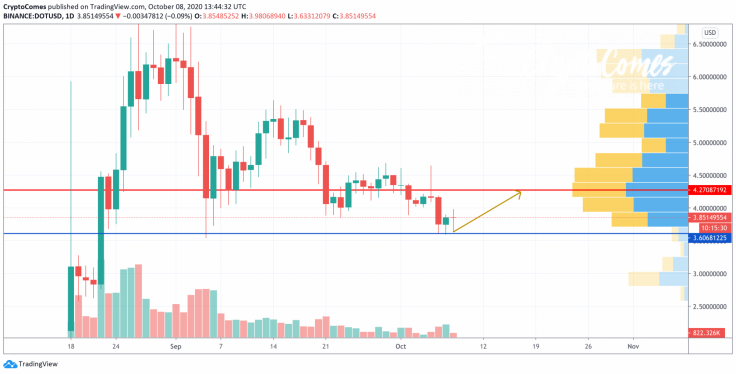
Polkadot (DOT) has touched the far retest zone at $3.60 and bounced off. From the technical perspective, one may expect a slight correction as bears have already run out of fuel based on low liquidity. Even though it is too early to consider the trend change, buyers may get the price of DOT to $4.27 shortly.
Polkadot is trading at $3.84 at press time.


