Bearish tendencies have become more powerful as Litecoin (LTC) is the only coin from the Top 10 list that is located in the green zone. The price of the "digital silver" has risen by 0.3%.
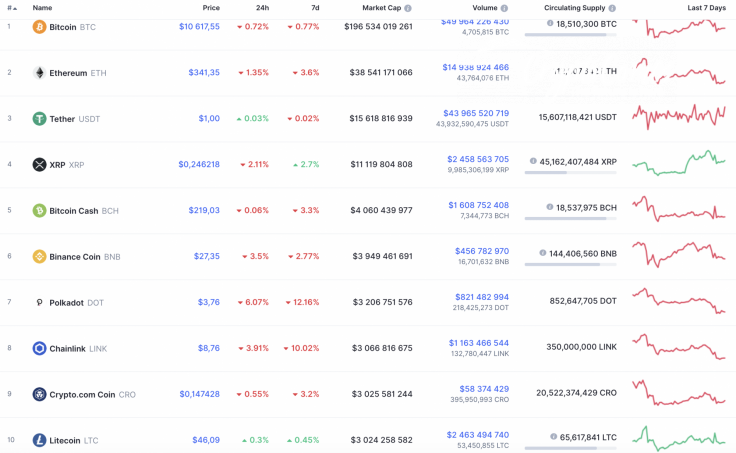
The key data for Bitcoin (BTC), Ethereum (ETH) and XRP:
|
Name |
Ticker |
Market Cap |
Price |
Volume (24h) |
Change (24h) |
|
Bitcoin |
BTC |
$196,534,019,261 | $10,617.55 | $49,964,226,430 | -0.77% |
|
Ethereum |
ETH |
$38,541,171,066 | $341.35 | $14,938,924,466 | -1.35% |
|
XRP |
XRP |
$11,119,804,808 | $0.246218 | $2,458,563,705 | -2.11% |
BTC/USD
Yesterday morning, the Bitcoin (BTC) price failed to break the blue trendline from the rising lows and, by the end of the day, it pulled back below the two-hour EMA55. In the support area of $10,500, sales volumes decreased and the decline slowed down.
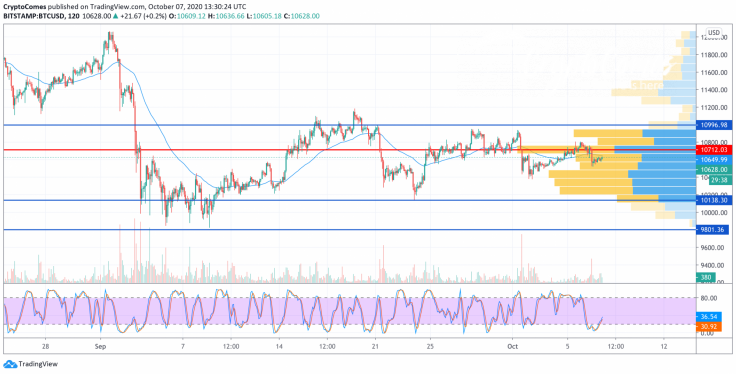
A slight recovery on small volumes may continue to the level of average prices, but the pair may not be able to overcome this resistance. Most likely, during the day, the decline will reach $10,400.
With increasing pressure from sellers, the fall may be more dynamic and will stop in the support area of $10,200.
Bitcoin is trading at $10,635 at press time.
ETH/USD
Small purchase volumes yesterday morning did not allow for the continuation of Ethereum's (ETH) recovery to the resistance of $360. Already in the first half of the day, pressure from sellers gradually increased, and they pushed through the two-hour EMA55.
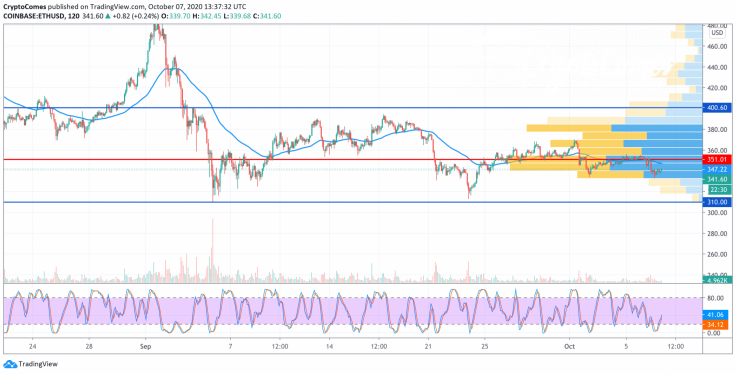
In the evening, the decline continued, and the pair set a weekly low around $333. If today buyers cannot return the pair above the average price level, then in the near future the price will test the support of $320.
Ethereum is trading at $341.58 at press time.
XRP/USD
Yesterday morning, buyers marked the October high around the $0.260 mark, but sellers did not allow the growth to continue and rolled back the price to the support of $0.250. It seemed that the rollback would end there, but late in the evening the pressure increased and the bears brought the price down below the two-hour EMA55.
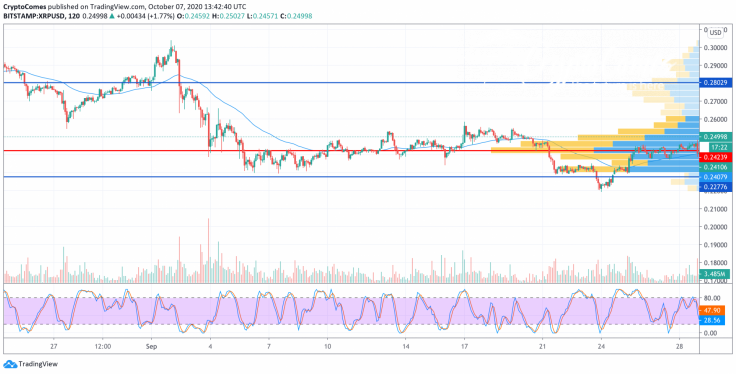
In the area of the POC line ($0.242), the decline stopped. As of this morning, sales volumes have decreased and the Volume Profile indicator line ($0.242) may support a full-scale recovery of the pair to the area of yesterday's high. In the absence of positive sentiment among buyers, the rollback will continue to support $0.230.
XRP is trading at $0.2496 at press time.


