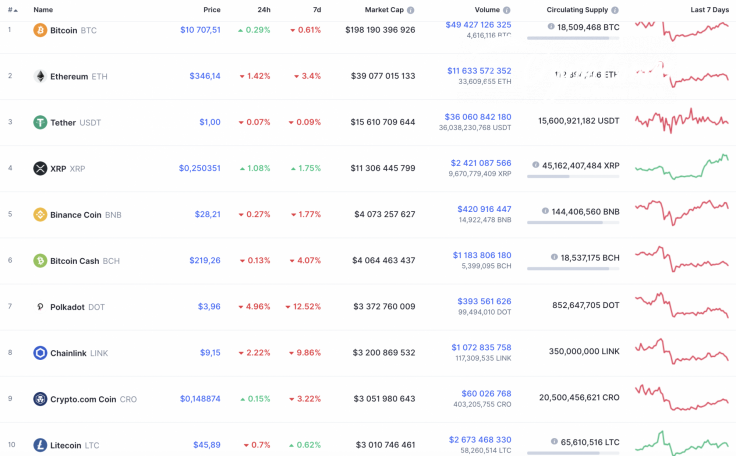
The bearish mood is becoming more powerful as almost all coins from the Top 10 list are in the red zone. XRP remains under a bullish influence after recent sharp growth.
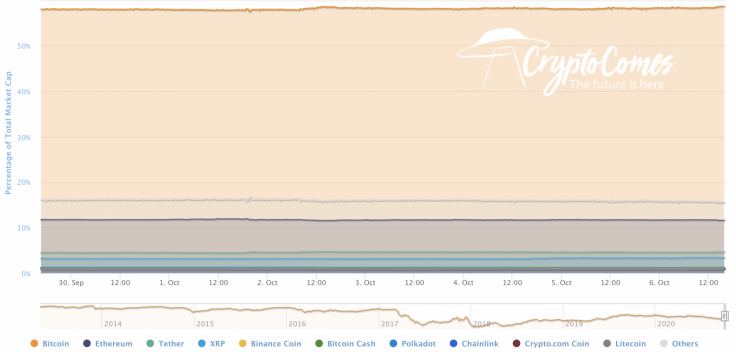
The market share of Bitcoin (BTC) has remained in the same position since yesterday, and the current dominance index makes up 58.3%.
The relevant data for Bitcoin today:
-
Name: Bitcoin
-
Ticker: BTC
-
Market Cap: $198,304,875,370
-
Price: $10,713.70
-
Volume (24h): $49,414,705,760
-
Change (24h): 0.25%
The data is relevant at press time.
BTC/USD: Can bulls get to $10,900 before a profound decline starts?
Buyers have already tested the trendline from last week's rising lows several times, but this morning they have not managed to break into the up channel. Trading volumes are still below average, and buyers have not yet managed to form a bullish momentum.

Considering that Stoch RSI indicator lines are now at the border of the overbought zone on the daily time frame, there is still potential for growth. But the target zone is limited by the resistance of $11,200.
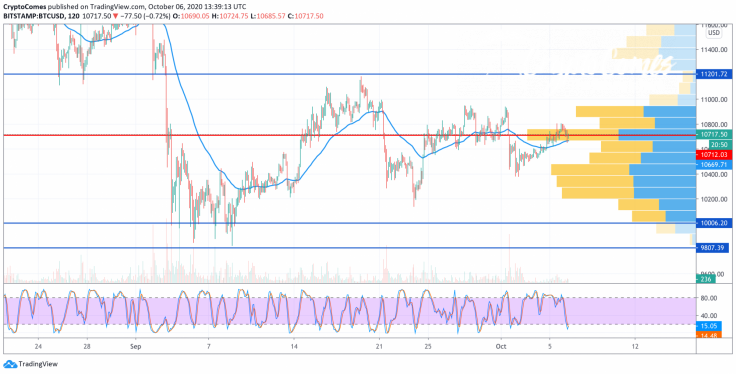
On the other hand, on the shorter time frame, a signal for a decline has formed. But it is too early to say that the market is already overheated. If there is no sharp surge in sales volumes, the buyer will try to gain a foothold above the trendline and break through to the target level of $11,200.
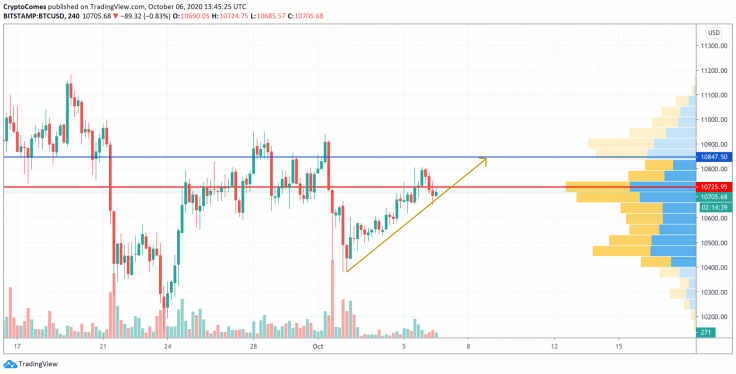
On the 4H chart, growth may continue to the resistance at around $10,900 as bears have not seized the initiative yet. At that level, there is a high probability of a false breakout. If Bitcoin (BTC) fixes above $11,000, the short scenario will not become relevant.

On the longer time frame, Bitcoin (BTC) is on its way to the area of $10,000. Bulls may have failed to achieve the crucial resistance of $11,000 followed by an ongoing decline. The support of $10,100 may be the first level where buyers may resist sellers. If they fail to do that, the important mark of $10,000 will be broken.
Bitcoin is trading at $10,687 at press time.


