The last day of the week, the cryptocurrency market is facing neither bullish nor bearish tendencies. The sideways trend is dominating the market at the moment, while Binance Coin (BNB) is the top gainer—rising by 3% over the last day.
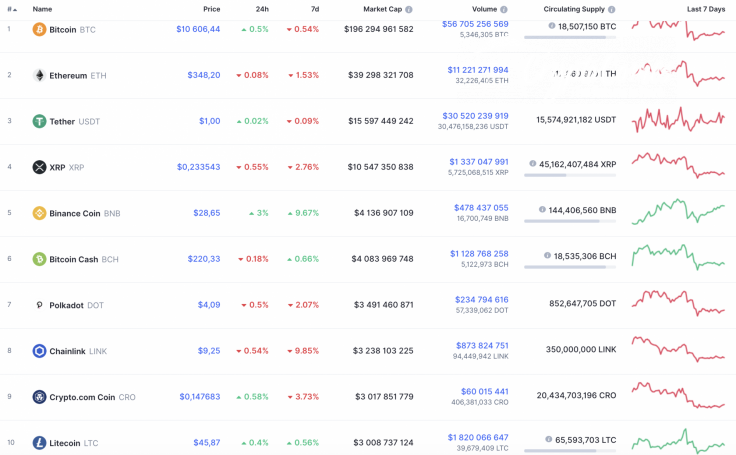
The key statistics on Bitcoin (BTC), Ethereum (ETH) and XRP for today:
|
Name |
Ticker |
Market Cap |
Price |
Volume (24h) |
Change (24h) |
|
Bitcoin |
BTC |
$196,294,961,582 | $10,606.44 | $56,705,256,569 | 0.5% |
|
Ethereum |
ETH |
$39,298,321,708 | $348.20 | $11,221,271,994 | -0.08% |
|
XRP |
XRP |
$10,547,350,838 | $0.233543 | $1,337,047,991 | -0.55% |
BTC/USD
The rate of Bitcoin (BTC) is almost unchanged over the last seven days. The price change has made up only -0.54%.
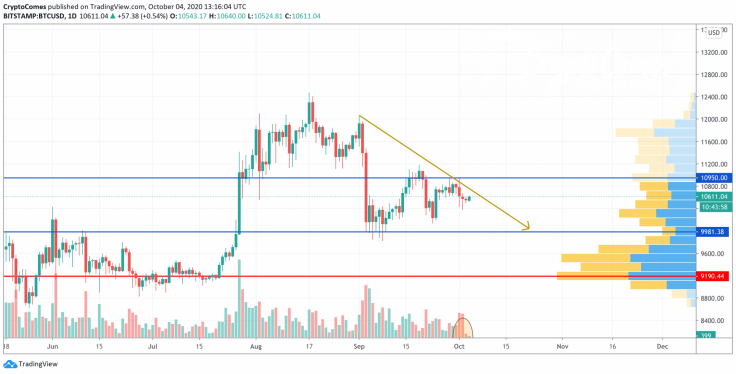
On the daily chart, Bitcoin (BTC) is trying to grow, however, the selling volume remains high. This means that the ongoing short-term rise is about to finish soon.
Thus, the chief coin has made a false breakout of the $10,950 resistance that confirms a high possibility of a drop from the current levels. All in all, in the upcoming week, Bitcoin (BTC) may touch the $9,900 mark.
Bitcoin is trading at $10,615 at press time.
ETH/USD
Ethereum (ETH) has been more volatile over the previous seven days than the leading crypto. The main altcoin has gone down by 1.53% over the last week.
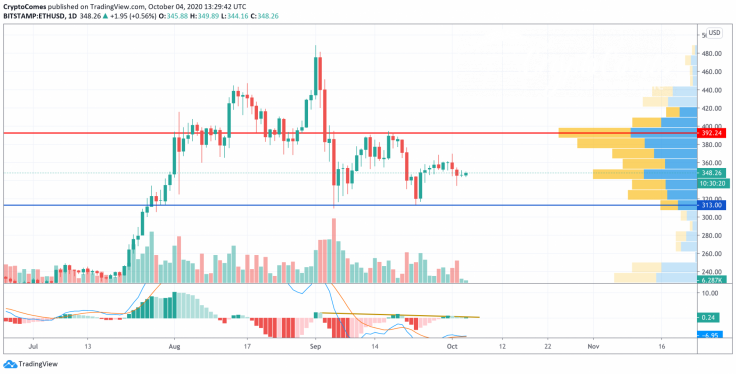
Ethereum (ETH) is also facing a bearish scenario on the daily time frame, which is confirmed by the hidden divergence on the MACD indicator. The falling option is more relevant because the trading volume is located at minimum levels. Bulls may show resistance only when they get to the support level at $313.
Ethereum is trading at $348.38 at press time.
XRP/USD
XRP is the most volatile coin over the last week from our list. The drop has accounted for 2.76%, while the price change since yesterday has constituted -0.55%.

From the technical point of view, XRP has also not gained enough power for a price blast. Even though liquidity is at a relatively high level, the volume is low, which prevents the coin from continued growth. In this case, a decline to $0.2195 is the most likely scenario for the next several days.
XRP is trading at $0.2411 at press time.


