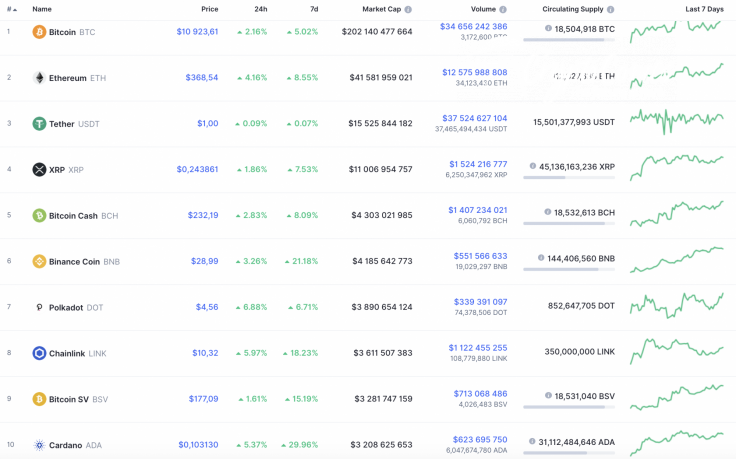
Bulls have totally seized the initiative today as all coins from the Top 10 list are again located in the green zone. Polkadot (DOT) is the main gainer among them, rising by 6.88%.
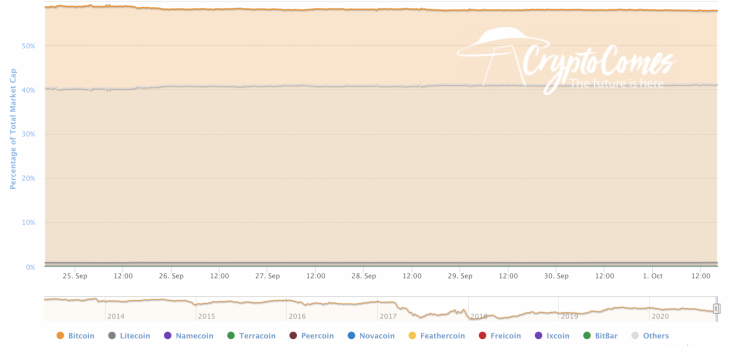
The dominance rate of Bitcoin (BTC) has gone down slightly as altcoins have become more volatile recently. In this case, the market share of the chief crypto has declined to 57.5%.
The relevant data of Bitcoin looks the following way today:
-
Name: Bitcoin
-
Ticker: BTC
-
Market Cap: $201,791,700,858
-
Price: $10,904.76
-
Volume (24h): $34,607,056,722
-
Change (24h): 1.73%
The data is relevant at press time.
BTC/USD: Can October start by breaking the $11,000 resistance?
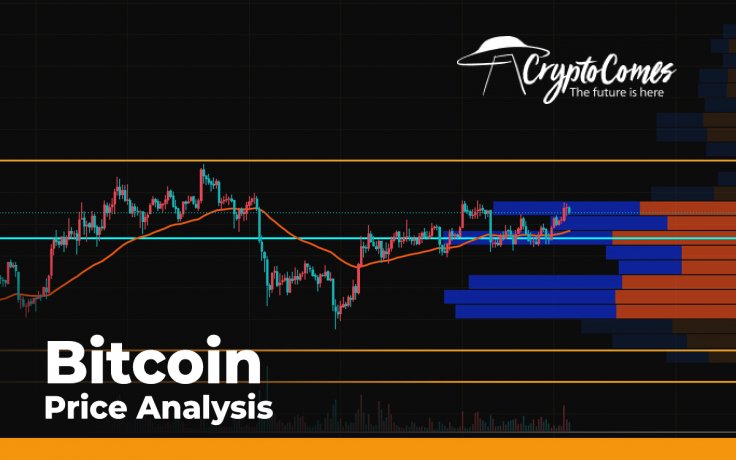
Over the past day, the market situation has not changed. The BTC/USD pair has maintained momentum with rising lows, but buyers are not yet ready to storm the $11,000 threshold. Trading volumes do not exceed the average level and, this morning, the Bitcoin (BTC) price remains above the two-hour EMA55.
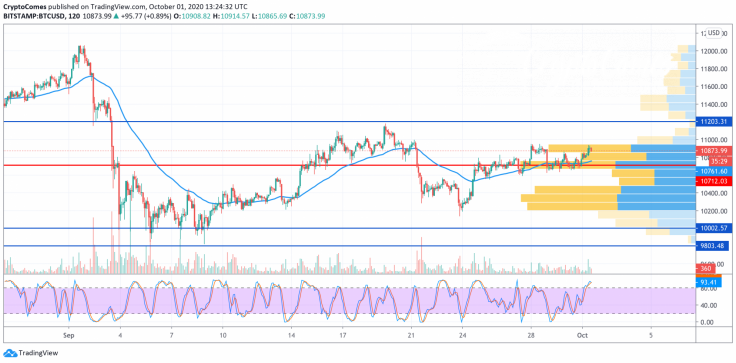
The bullish scenario yesterday is still valid, and a retest of the key resistance at $11,200 is essential to understanding whether the bull run in October can continue to new annual highs.
Equally important is the strengthening of bears' positions, as a result of which a breakout of the psychological level of $10,000 is possible. In this case, support at $9,800 will be a buffer zone that will keep the market from falling dynamically for a while.
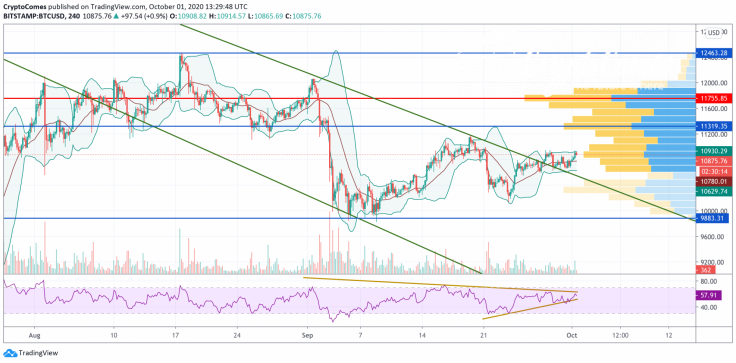
On the 4H chart, quotes have broken through the neckline of the inverted head and shoulders reversal pattern. However, to confirm the development of the upward movement, it is also important to overcome the nearest maximum with price fixing above the $11,200 level. In this case, it will be possible to speak of the development of a reversal pattern with the target above $13,500. Cancellation of this scenario may signal a strong fall in the price of the asset, fixing below the level of $10,105. This will indicate a halt in the development of the reversal pattern and the potential for a further decline to the level of $9,035.
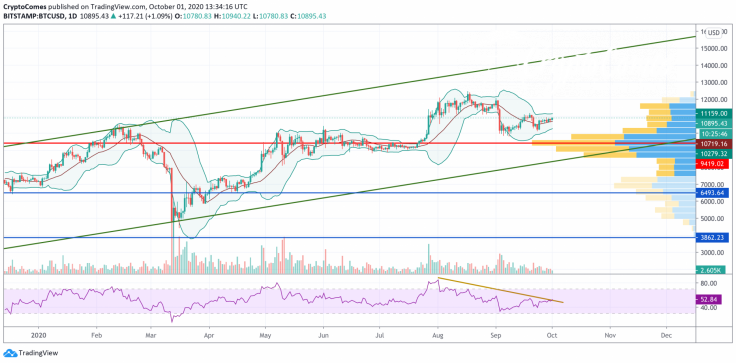
On the daily chart, BTC quotes remain above the support area; however, the $11,200 level has not yet been broken through. The asset price is between important marks. Neither buyers nor sellers have the strength to leave the corridor. The breakdown of the downward trend line on the RSI indicator is in favor of the beginning of price growth. As a rule, such a signal indicates the breaking of a similar line or the nearest resistance level on the price chart.
A confident breakout of the $11,200 level will indicate a continued rise to $12,495 and above. If sellers manage to push through the $10,000 level, the BTC/USD quotes may fall to the $8,000 level within the bullish 5-0 pattern. This pattern assumes a further rebound from the lower border of the ascending channel and continued growth.
Bitcoin is trading at $10,893 at press time.
