The bearish mood has returned to the cryptocurrency market; however, it does not apply evenly to all of the Top 10 coins. Mainly, XRP and Binance Coin (BNB) are the only digital assets that are still located in the green area.
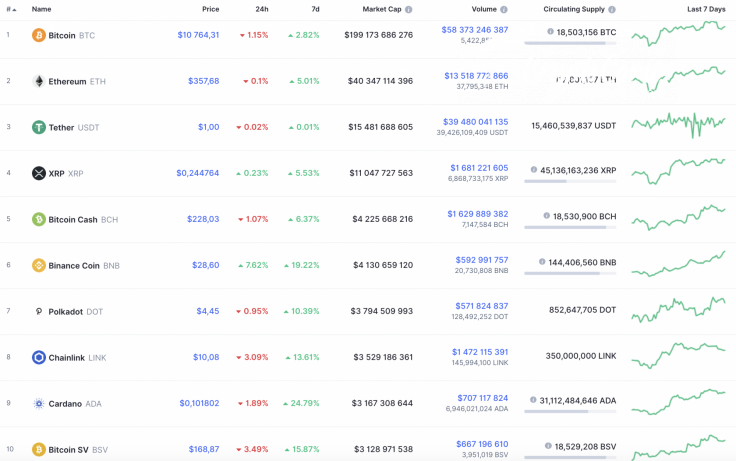
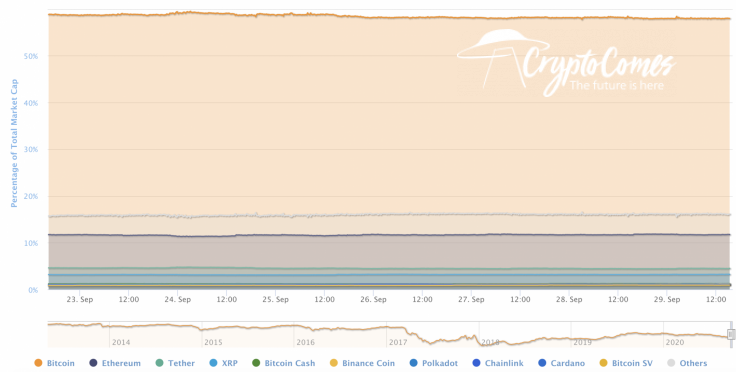
As altcoins tend to be more volatile now than BTC, the dominance rate of the chief crypto has slightly declined and is now at 57.5%.
The relevant data for Bitcoin is looking the following way:
-
Name: Bitcoin
-
Ticker: BTC
-
Market Cap: $199,278,994,946
-
Price: $10,770
-
Volume (24h): $58,268,441,236
-
Change (24h): -1.08%
The data is relevant at press time.
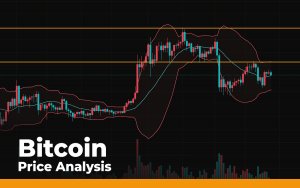
BTC/USD: Can the $11,000 mark be attained this week?
Yesterday, buyers were unable to increase trading volume, and the price of Bitcoin (BTC) could not overcome the threshold of $11,000. By the end of the day, the pair held in the area of $10,800, and at night sellers returned the price below the level of the two-hour EMA55.
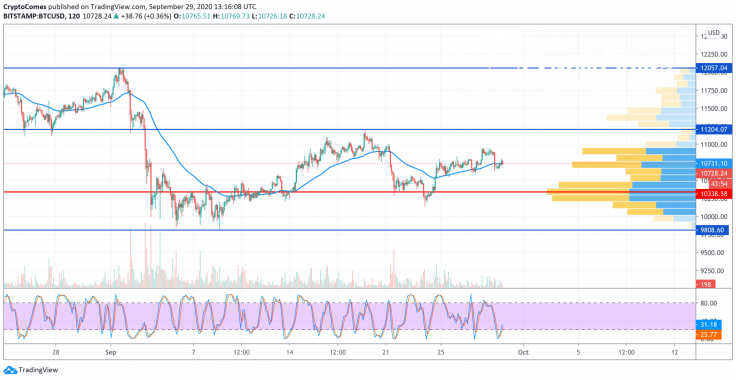
The pullback has stopped at around $10,680. If today bears intensify the onslaught and push the level of $10,500, then the decline will slow down in the area of the POC line ($10,277).
Given the slight correlation of the Bitcoin price with the stock market, it can be assumed that the BTC/USD pair may try to follow the growing SPX and DJI indices for the second day. In this case, buyers will be able to test the resistance of $11,200.
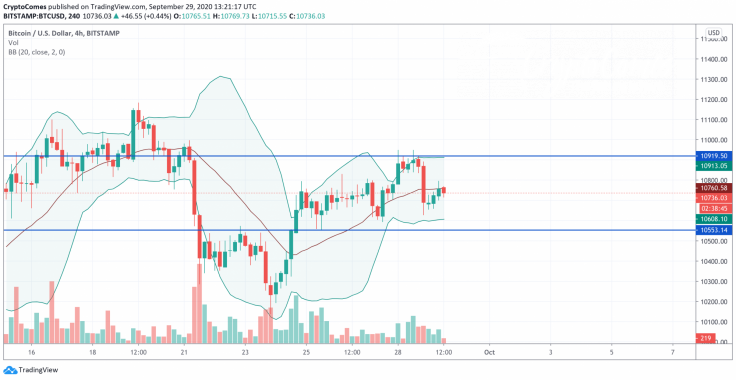
On the 4H time frame, short-term growth is the more likely price action at the moment. At the moment, Bitcoin (BTC) is trying the break the basic line of the Bollinger Bands indicator. The selling volume is low, which means that it may succeed. However, it is unlikely to set new peaks. That is why traders may expect a false breakout of the resistance at $10,920 before a further drop.
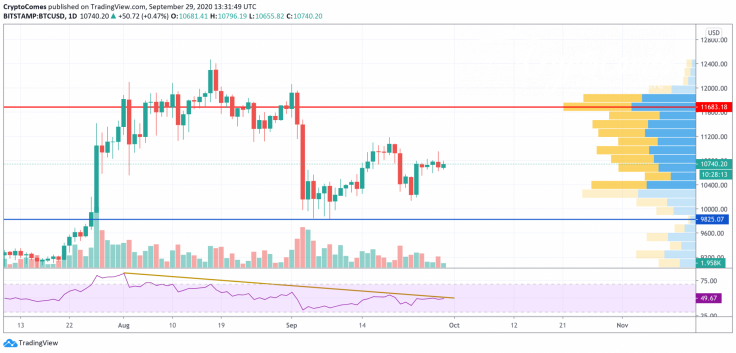
Bitcoin (BTC) is trying to grow after it bounced off the $9,800 level. However, the ongoing rise is not supported by increasing trading volume, which means that the growth may be false. Thus, the leading crypto has formed a bearish divergence on the RSI indicator, which considers a possible price drop. All in all, there is a high probability of seeing BTC at around $10,000 soon.
Bitcoin is trading at $10,739 at press time.


