
The last day of the week has been neither bullish nor bearish as some of the coins have already switched to the red zone, while the others remain under bulls' dominance.
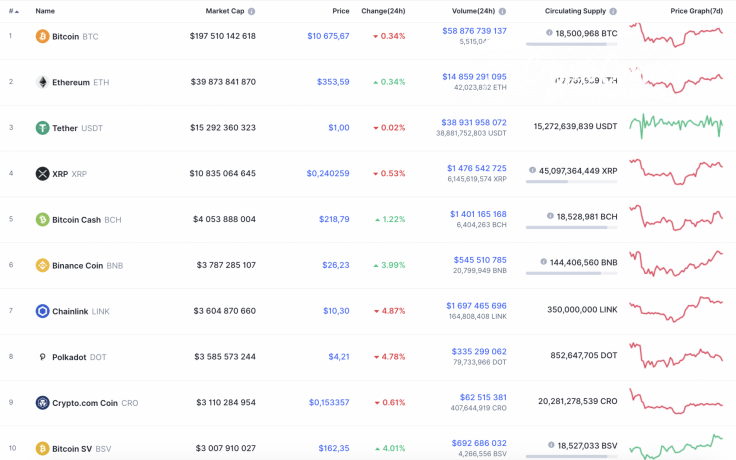
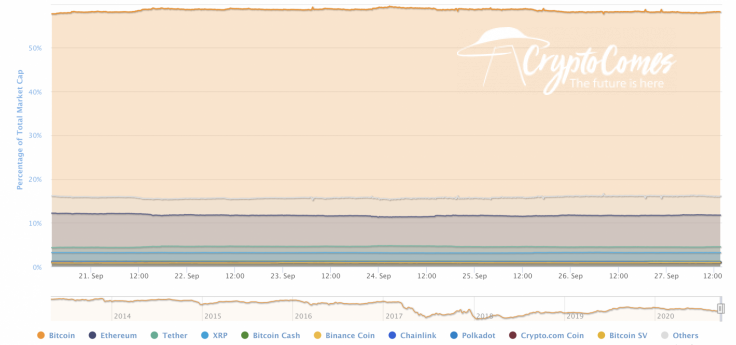
As the altcoin market has lost more than Bitcoin (BTC) over the last week, the dominance rate of the leading crypto has risen and now makes up 57.8%.
The relevant data for Bitcoin today:
-
Name: Bitcoin
-
Ticker: BTC
-
Market Cap: $197,292,999,383
-
Price: $10,663.93
-
Volume (24h): $52,602,680,338
-
Change (24h): -0.41%
The data is relevant at press time.
BTC/USD: Can one expect a rise to $11,000 in the next week?
The passing week has been neither bullish nor bearish as the rate of Bitcoin (BTC) is almost unchanged over the previous seven days. The price since yesterday has accounted for -0.41%.
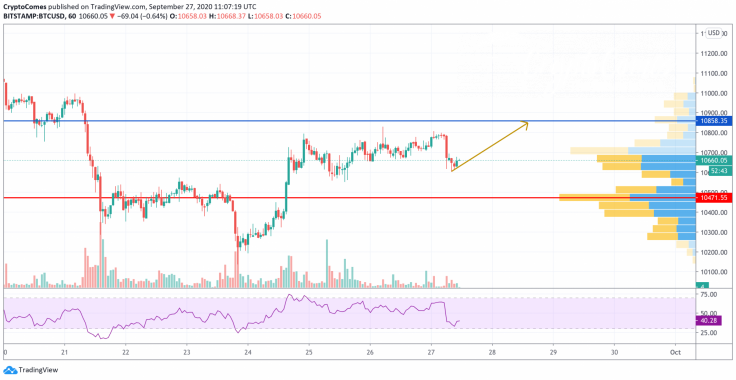
On the hourly chart, Bitcoin (BTC) has retested the liquid level at $10,600. Analyzing the technical situation, it has low chances of updating the peaks as the trading volume has declined. However, the coin is located on the verge of the oversold level based on the value of the RSI indicator, which means that traders may expect another wave of growth to around $10,850 before a more profound drop starts.
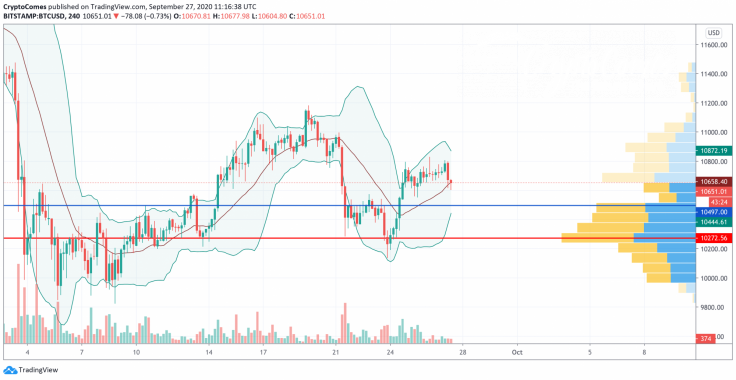
On the bigger time frame, the situation is reversed. The current liquidity level is too low to hold the rate of Bitcoin (BTC) at the current prices. The same issue is applied to decreasing trading volume. Applying the Bollinger Bands indicator to the chart, the first stop where buyers might show power is the $10,500 mark, which corresponds to the support line of the indicator.
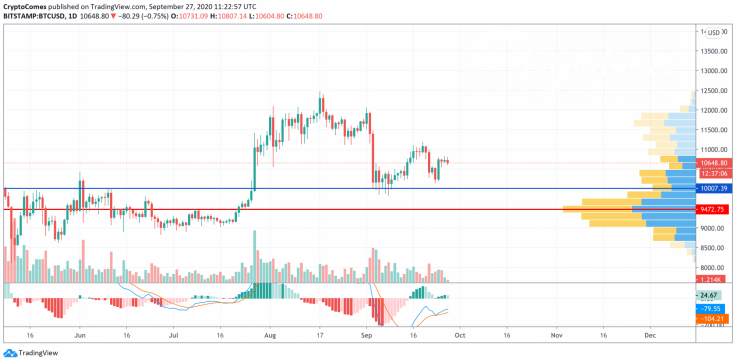
On the daily chart, sellers are also dominating the market. After a bounce off the support at $10,100, bulls failed to retest $11,000, having confirmed the upcoming bearish pressure. The MACD indicator also considers the switch to the "short" zone, with the nearest target at about $10,000, which should be attained by the end of next week.
Bitcoin is trading at $10,652 at press time.


