
The situation on the market is almost unchanged since yesterday. The only coin that is trading in the green zone is Bitcoin (BTC), whose rate has increased by 1.73%.
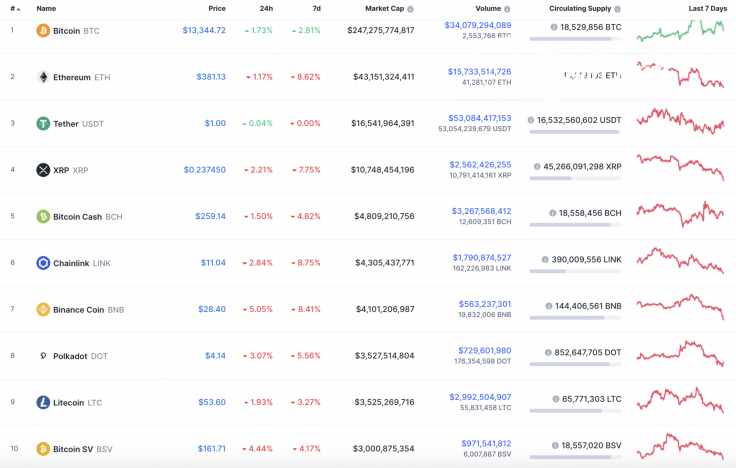
Meanwhile, the market capitalization is unchanged despite the fact that most of the coins are under the influence of bearish sentiments. The current index accounts for $390 bln.

The relevant data for Ethereum is looking the following way:
-
Name: Ethereum
-
Ticker: ETH
-
Market Cap: $43,117,705,368
-
Price: $380.83
-
Volume (24h): $15,704,905,185
-
Change (24h): -0.79%
The data is relevant at press time.
ETH/USD: Can Ethereum fix above $400 in the short-term perspective?
Yesterday morning, the trading volumes were below the average level, and the pair traded for a short time around the $390 mark. The bulls could not continue to grow, so the Ethereum (ETH) price rolled back to the support of $380.

In the afternoon, buyers restored the pair to the mid-range, but the 6-hour EMA55 is holding back the growth and not allowing a return to the psychological level of $400.

If the bulls fail to break through this level of average prices, then the pullback will continue to the support of $360.
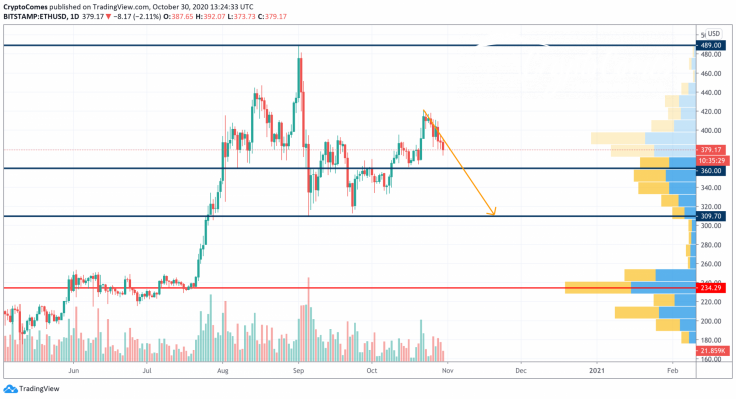
On the bigger time frame, Ethereum (ETH) is even more bearish. The leading altcoin is slowly approaching the closest support zone at $360 against the increasing selling trading volume. In case this level cannot stop the drop, there is a high chance of seeing a retest of $309 where most of the liquidity is focused.
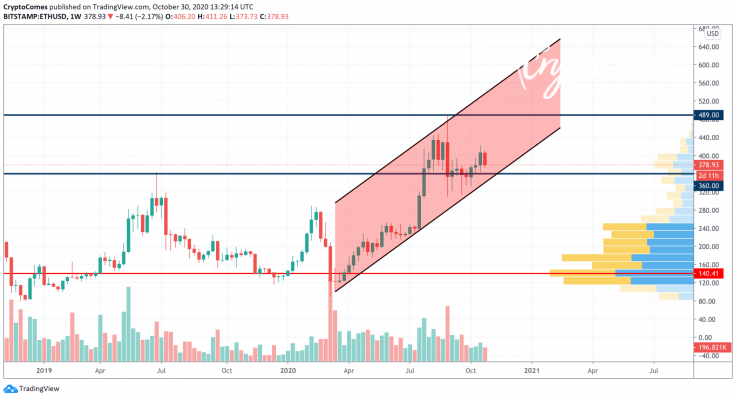
On the weekly chart, Ethereum (ETH) is bullish despite short-term corrections. The altcoin is trading within the rising channel since a sharp drop in March. At the moment, the crypto has little chance of setting new peaks. However, a false breakout of the resistance at $489 may occur if the volume and liquidity remain at a low level.
Ethereum is trading at $379.32 at press time.


