The cryptocurrency market may have started the correction period as most of the Top 10 coins are in the red zone. The only exception to the rule is Bitcoin Cash (BCH), whose rate has risen by 3.78% over the last day.

The key information for Bitcoin (BTC), Ethereum (ETH) and XRP:
|
Name |
Ticker |
Market Cap |
Price |
Volume (24h) |
Change (24h) |
|
Bitcoin |
BTC |
$245,874,096,576 | $13,270.11 | $38,015,459,077 | -1.16% |
|
Ethereum |
ETH |
$44,092,704,975 | $389.54 | $16,210,390,578 | -2.92% |
|
XRP |
XRP |
$11,277,088,493 | $0.249129 | $2,474,153,417 | -1.15% |
BTC/USD
Yesterday, another attempt by the bulls to break through the resistance of the 61.8% Fibo level ($13,346) ended with the renewal of the annual high. At night, the growth continued, and in the morning, the price of Bitcoin recorded a record value of around $13,865.
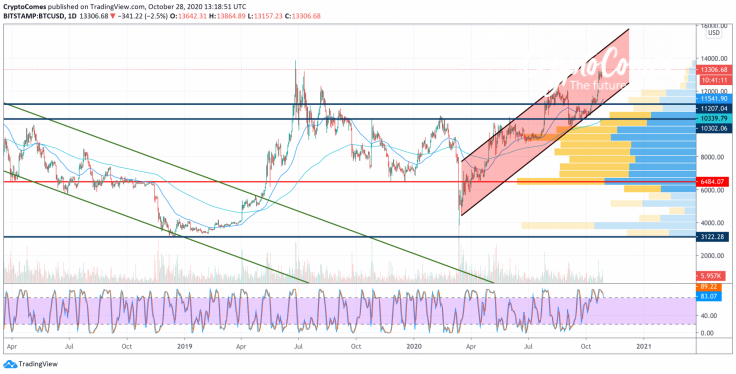
Bitcoin (BTC) came close to the two-year high of $13,880, which was set on June 26, 2019. If bulls can continue the rise, then the price will test the $14,000 mark.
Meanwhile, the pair has already rolled back to the lower border of the upward blue channel. One may assume that the 61.8% Fibonacci level will be able to stop the decline.
Bitcoin is trading at $13,278 at press time.
ETH/USD
Yesterday morning, after a short-term consolidation, the Ethereum (ETH) price continued to recover, and buyers were able to bring the pair back above the psychological level of $400.
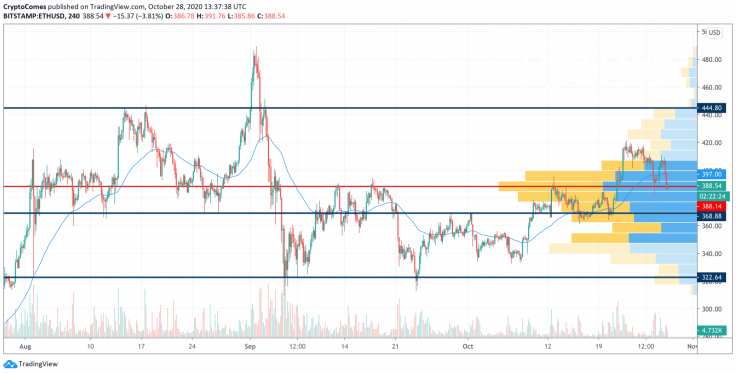
In the afternoon, buyers dominated the market and, at the end of the day, the price recorded a daily high of around $410. At night, the volumes decreased and the pair rolled back a little, but so far it is holding above the level of $400. If Bitcoin (BTC) continues to grow, then the correlation component will pull the ETH price to a new weekly high in the blue trendline area ($430). If there is no excitement growth, then the price of the main altcoin on small volumes may roll back below the level of average prices.
Ethereum is trading at $388.37 at press time.
XRP/USD
Yesterday, the XRP price recovered to the four-hour EMA55 area. At night, the pair continued to recover, but by this morning did not manage to reach the upper border of the wide sideways corridor of $0.260.
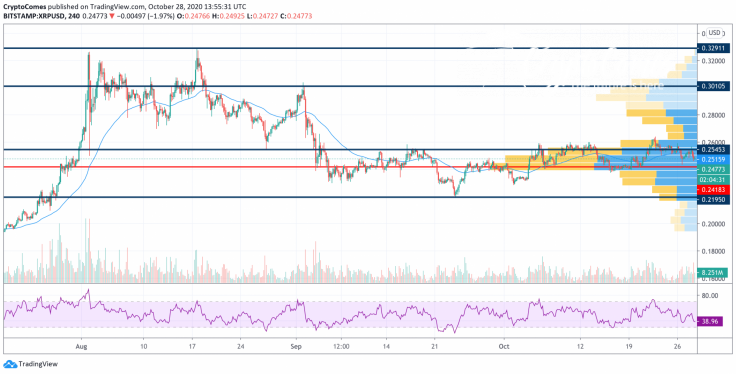
If buying volumes remain above average today, the pair will test the resistance of $0.260. With a decrease in volume, the XRP price might roll back to the POC line ($0.242).
XRP is trading at $0.2477 at press time.


