The new week has started with a relatively neutral mood on the cryptocurrency market. Most of the Top 10 coins are in the green zone; however, there are also exceptions to the rule. Bitcoin Cash (BCH) has fallen by 1.51% over the last day.
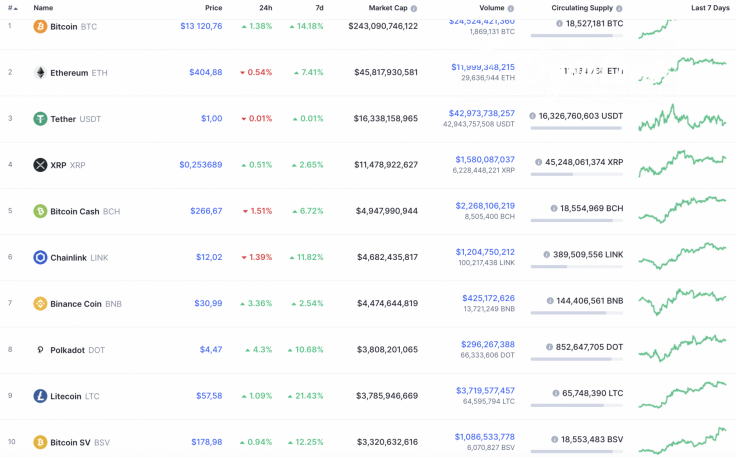
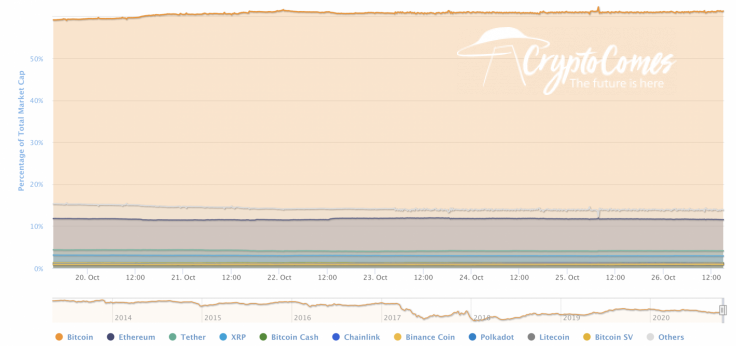
The market share of Bitcoin (BTC) keeps strengthening as most of the altcoins have already entered the correction period. The current dominance rate of the main crypto makes up 61.3%.
The relevant data of Bitcoin is looking the following way:
-
Name: Bitcoin
-
Ticker: BTC
-
Market Cap: $243,786,810,937
-
Price: $13,158.33
-
Volume (24h): $24,728,999,919
-
Change (24h): 1.46%
The data is relevant at press time.
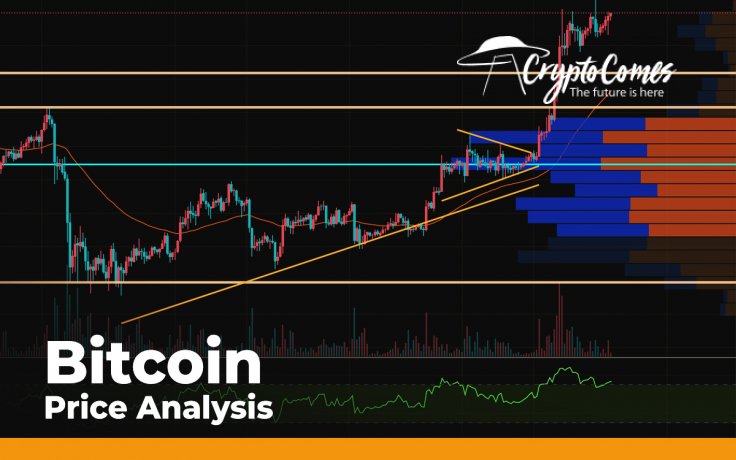
BTC/USD: How much time do bulls need to get to $14,000?
Over the past weekend, the Bitcoin price recovered into an upward channel, above the blue trend line, and it was able to test the 61.8% Fibo level ($13,346). The annual maximum was set around $13,363, but it has not yet been possible to gain a foothold in the maximum zone; sellers immediately knocked the pair out of the ascending channel.
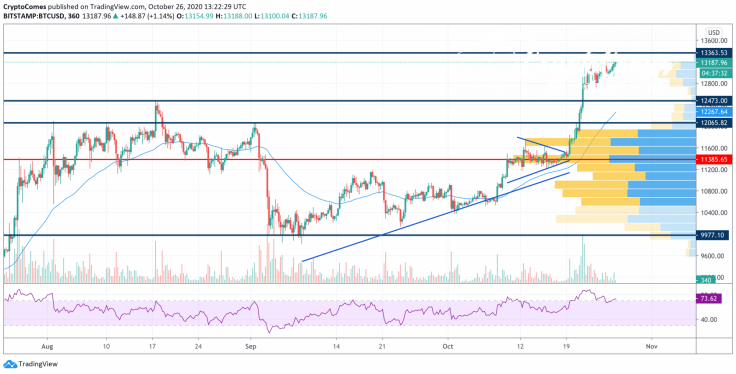
The bulls are not giving up and are preventing the formation of declining lows. This morning they will again try to overcome the uptrend line and consolidate above the 61.8% Fibonacci level.
It should be noted that, on the daily time frame, the RSI indicator lines are going off scale in the overbought zone. At the end of the week, the volume of purchases significantly decreased. This is a clear signal for an upcoming price decline. If the bulls fail to gain a foothold above the 61.8% Fibo level ($13,346), then the pair can quickly roll back to the area of average prices.
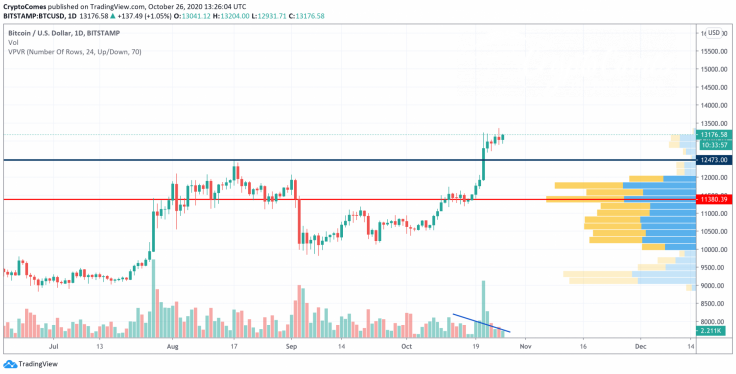
On the daily chart, the trading volume is going down, which means that traders have already started fixing their positions and a decline might happen soon. In this regard, if the price of the main crypto drops below the crucial $13,000, it has all the chances of testing the "mirror" level of around $12,500 shortly.
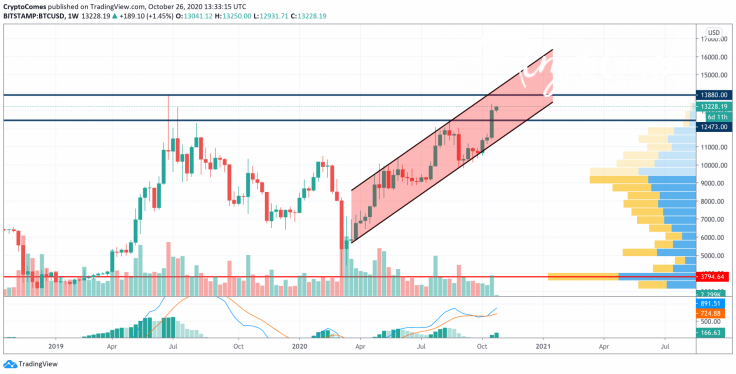
On the weekly time frame, the main crypto is still looking bullish and is about to target the resistance at $13,880. The rising MACD indicator supports the ongoing growth. However, it is unlikely to touch $14,000 for the first time as the volume, as well as the liquidity, is at its lowest levels.
Bitcoin is trading at $13,183 at press time.


