As the end of the week is approaching, some coins have returned to the green zone. However, most of them are still under bearish pressure. Chainlink (LINK) is the biggest loser out of the Top 10 cryptocurrencies. Its rate has declined by 3% over the last day.
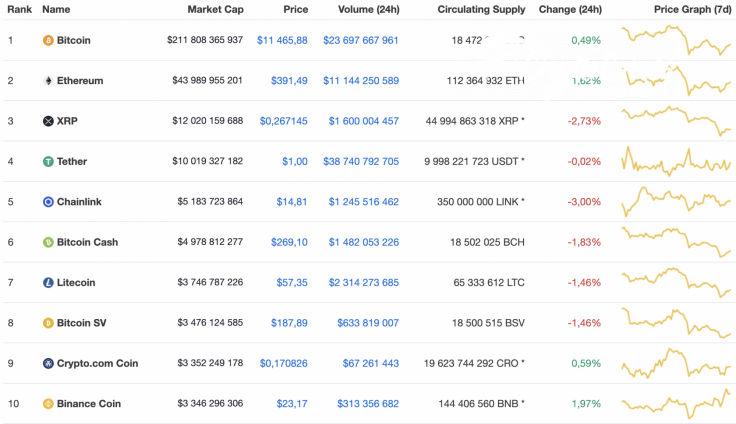
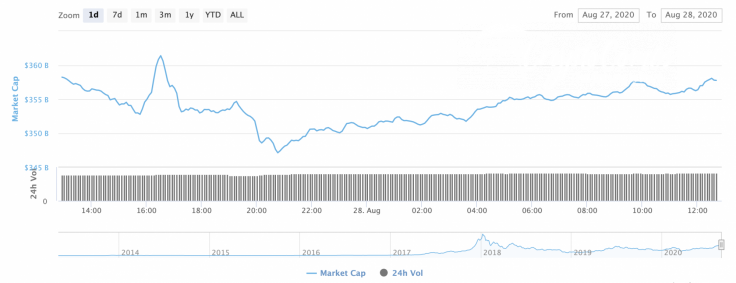
The slight rise of altcoins has not influenced total market capitalization, which is unchanged since yesterday and currently sits at $357 bln.
The relevant data for Ethereum is looking the following way:
-
Name: Ethereum
-
Ticker: ETH
-
Market Cap: $43,964,422,948
-
Price: $391.26
-
Volume (24h): $11,165,377,634
-
Change (24h): 1.56%
The data is relevant at press time.
ETH/USD: Can bulls fix above $400 this time?
Yesterday's consolidation of the Ethereum (ETH) price in a narrow range, around $383, was broken by a sharp bullish impulse that pierced the POC line ($395). In response, bearish momentum renewed the weekly low at $368.50.
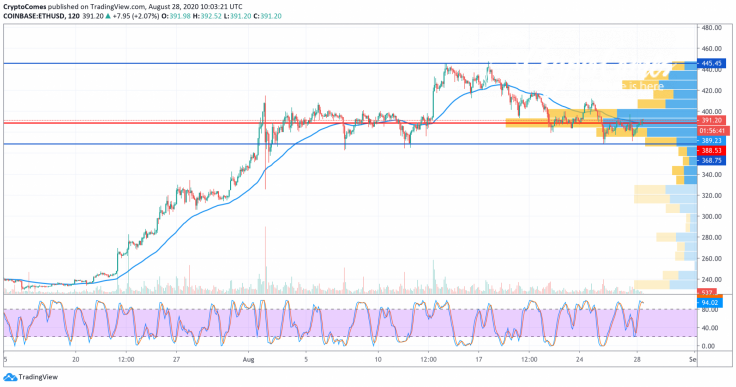
Late in the evening, the situation stabilized, trading volumes decreased, and the pair recovered to the level of average prices. Today the consolidation may continue, but the strengthening of the bearish onslaught could lead to a breakout of the support of $360 and a retest of the trendline.
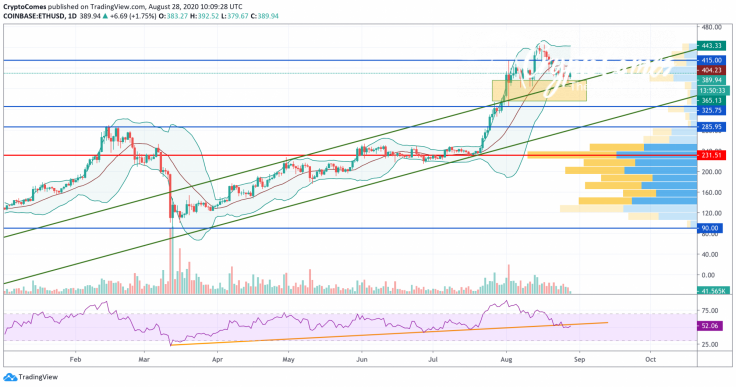
On the daily chart, Ethereum (ETH) has not yet been able to go above the $450 level, but it has also not dropped below the support level. The lower border of the Bollinger Bands indicator was just tested, which confirms the numerical superiority of buyers in the market.

At the same time, there is a breakdown of the support line at the RSI. If in the near future the indicator will again consolidate above the support, it will be possible to talk about continued growth. There has been no clear breakdown yet. A strong signal in favor of this option would be a rebound from the upper border of the ascending channel.
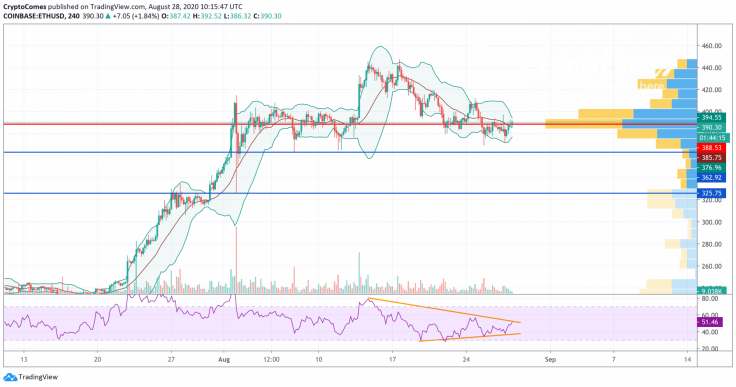
On the 4H time frame, the leading altcoin is forming a "head and shoulders" reversal pattern. To complete the figure, it is important to see the test of the $415 level, where the end of the right shoulder of the pattern is expected. A confirmation of the further development of the model would be the breakdown of the $365 level, which may provoke a decrease in the price under the neck line, and then to the $305 level. A rebound from the resistance line at the RSI would be in favor of this option.
Ethereum is trading at $390.87 at press time.


