The DeFi tokens are mostly trending bullish; however, this does not apply to all assets. Coins such as Ampleforth (AMPL) are growing by 20% per day, while the rate for Kyber Networks (KNC) has lost 1.18% since yesterday.
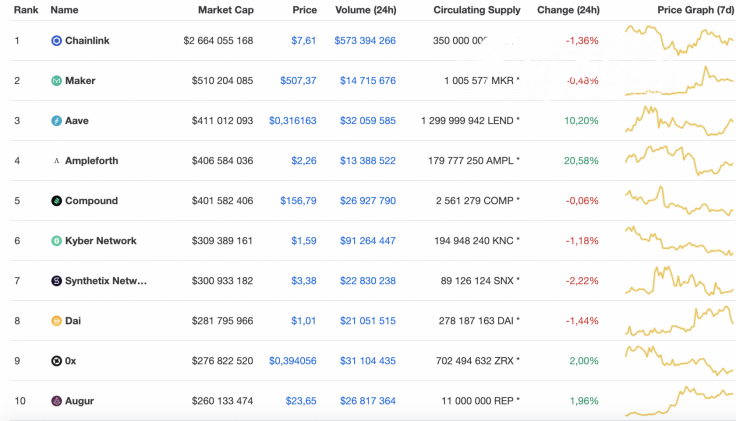
Below is the key data for Chainlink (LINK), Syscoin (SYS), and 0x (ZRX):
|
Name |
Ticker |
Market Cap |
Price |
Volume (24H) |
Change (24H) |
|
Chainlink |
LINK |
$2,664,055,168 |
$7.61 |
$573,394,266 |
-1.36% |
|
Syscoin |
SYS |
$59,874,985 |
$0.101314 |
$5,917,464 |
-11.47% |
|
0x |
ZRX |
$276,822,520 |
$0.394056 |
$31,104,435 |
2% |
LINK/USD
Chainlink (LINK) is trying to maintain growth after facing a recent correction. However, the decline is likely to continue as the trading volume remains at its lowest levels.
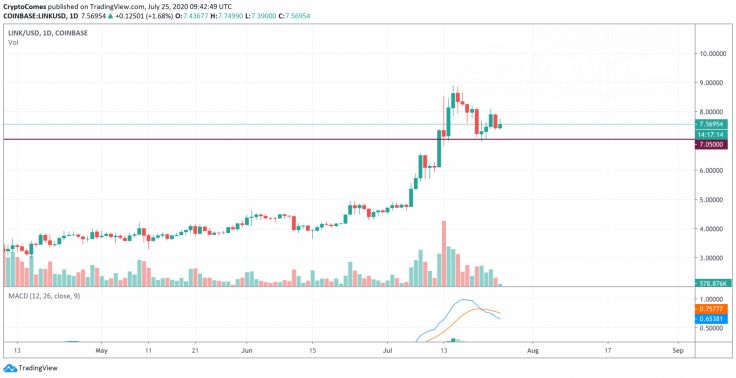
Looking at the daily time frame, considering the ongoing price drop, the lines of the Moving Average Convergence/Divergence (MACD) continue to go down. What is more, the last bullish candles closed with long wicks, signaling the absence of the efforts by buyers. If the decline continues, then the bears may push LINK to $7.05 soon.
At press time, Chainlink was trading at $7.55.
SYS/USD
Syscoin (SYS) is the biggest loser from our list. The price of the altcoin dipped by more than 11% in the last 24 hours, while the price of the coin soared by 150% from the previous week.
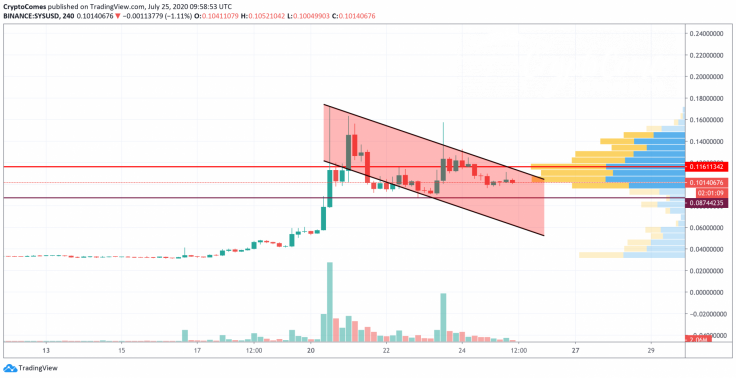
Looking at the 4H chart, Syscoin (SYS) is trading in a wide falling channel. The trading volume is low; however, the liquidity is quite high, which means that the altcoin is unlikely to face a sharp drop from its current levels. The more likely price prediction is a decrease to $0.87 followed by a price bounce back. Such a scenario is relevant for the upcoming week.
At press time, Syscoin was trading at $0.1011.
ZRX/USD
0x (ZRX) is located at the start point of a possible bullish wave. The rate of the coin has increased by 2% in the last 24 hours, while the price change in the last 7 days has dropped by -3.75%.
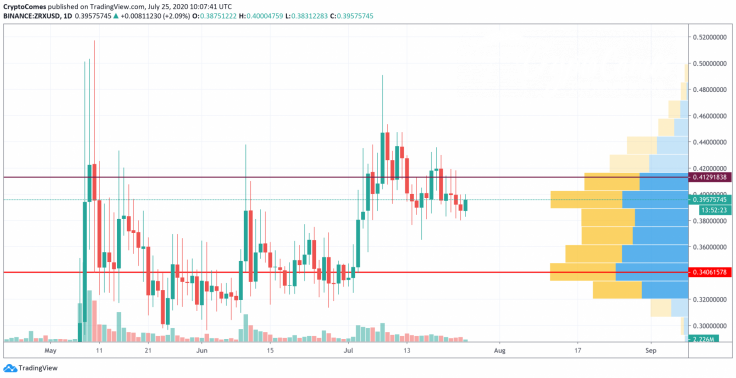
ZRX might have touched its local support level at $0.38 where buyers have shown a bounce back. The buying volume for ZRX has increased to a certain extent; however, it is still not high enough to create new peaks. If the slight ongoing rise continues, then the bulls may push ZRX to its next crucial level of $0.4129 shortly.
At press time, ZRX was trading at $0.3959.


