The weekend started with a correction of some of the Top 10 cryptocurrencies. Chainlink (LINK) is the biggest loser from the list, having declined 3.25% since yesterday.
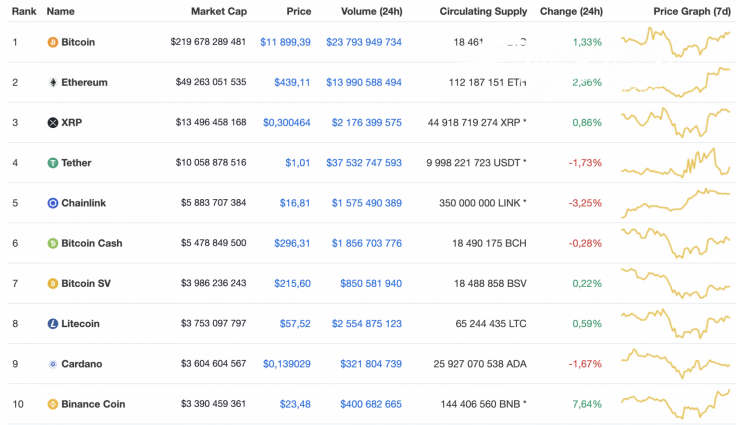
Despite the current price drop, the cryptocurrency market has increased significantly since last week. Its total capitalization has increased by $20 billion and now sits at $372 billion.

Below is the relevant data for Chainlink and how it's looking today:
-
Name: Chainlink
-
Ticker: LINK
-
Market Cap: $5 909 765 339
-
Price: $16,89
-
Volume (24H): $1,568,748,395
-
Change (24H): -2.71%
The data was relevant at press time.
LINK/USD: How Long Can Chainlink Remain in the Top 5?
Even though Chainlink (LINK) is today's biggest loser, its rate has skyrocketed up 60% from the last 7 days, which means that buyers have confirmed a bullish trend.
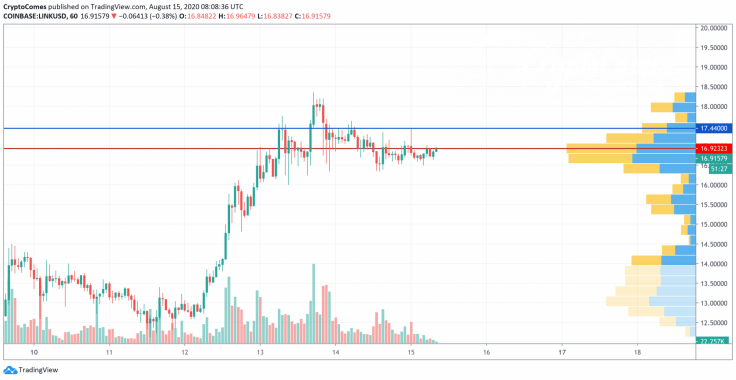
Looking at the hourly chart, Chainlink (LINK) is consolidating between the $16.50-$17 range. The trading volume is declining, which means that the bulls are losing their efforts and a possible correction awaits us.

However, the liquidity level is still high, which means that there are buyers who still want to buy LINK at the current prices. This is why a short-term rise to $17.44 may happen, followed by a more profound price drop.
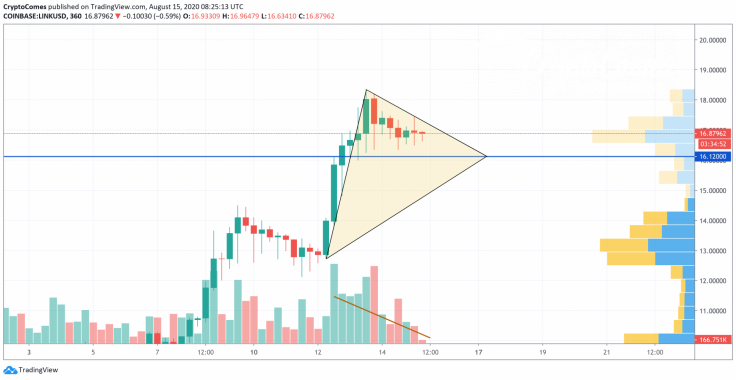
Looking at the bigger chart, Chainlink (LINK) made a false breakout at the $18 mark, confirming the lack of buyers to maintain the rise. Although the long-term trend remains bullish, a deep correction is needed to continue the price rise. Furthermore, the buying trading volume is going down, which considers an upcoming decrease. If that occurs, the closest support zone is $16.12, and that may be attained within the next few days.
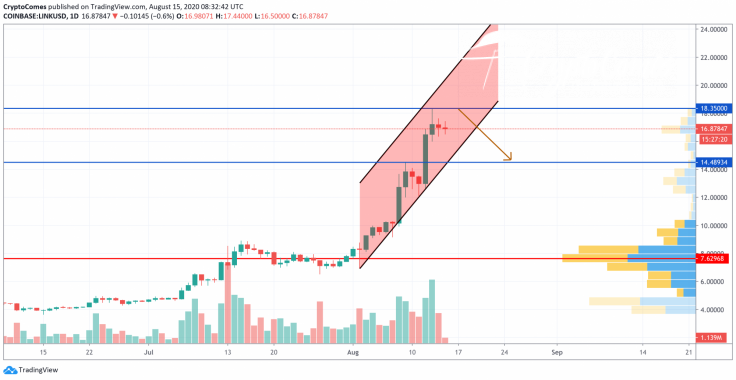
Looking at the daily time frame, Chainlink (LINK) is trading within the ascending channel that was formed at the beginning of August 2020. The trading volume is not so high as before, which means that the altcoin may decline to gain efforts for a further price decline before updating peaks. To sum it up, the bulls may retest the $18.35 mark before the start of a correction.
At press time, Chainlink was trading at $16.86.


