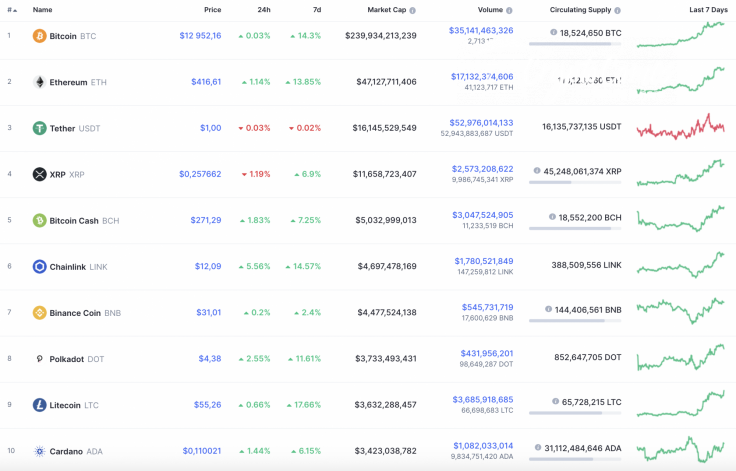
The cryptocurrency market is still bullish, but buying pressure is getting weaker and some coins are already in the red. Namely, XRP is down 1.19 percent over the past day.
Here's the main data for Bitcoin (BTC), XRP, and Stellar (XLM).
|
Name |
Ticker |
Market Cap |
Price |
Volume (24h) |
Change (24h) |
|
Bitcoin |
BTC |
$239,934,213,239 | $12 952,16 | $35,141,463,326 | 0.03% |
|
XRP |
XRP |
$11,658,723,407 | $0,257662 | $2,573,208,622 | -1.19% |
|
Stellar |
XLM |
$1,794,249,638 | $0,086028 | $178,644,770 | -0.01% |
BTC/USD
Yesterday morning, the Bitcoin pullback stopped at $12,780, and the bulls made another attempt to gain a foothold in the ascending channel towards the end of the day. Buyers managed to pierce the lower line of the channel, but they did not manage to stay above it.
At night, the cryptocurrency touched the $12,900 level and then continued to trade in a very narrow range this morning.
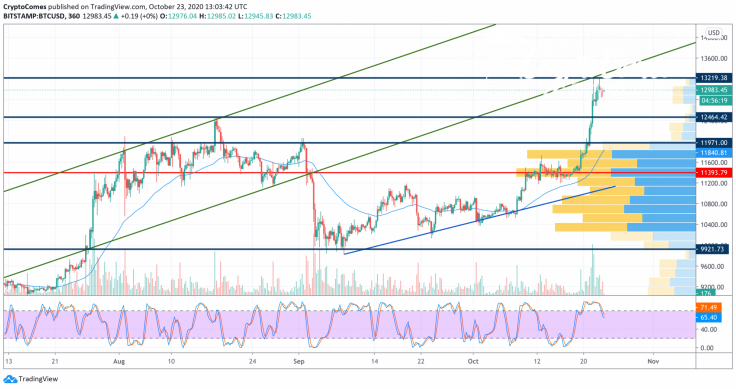
Today, another attempt at breaking above the key 61.8 percent Fibonacci retracement level ($13,346) is possible. The price of Bitcoin (BTC) may update the annual high by surging to $13,400, but the bears are unlikely to let this happen. The most likely retracement level is the August high of $12,473.
Bitcoin is trading at $12,995 at press time.
XRP/USD
Yesterday, the bulls managed to breach the powerful resistance of $0.26 and reach the October high at $0.264. This morning, the pair failed to remain in the zone of the monthly high and dipped back below the above-mentioned level.

It seems like the pair may find support around the $0.255 mark and repeat the breakout of the upper line of the wide sideways channel. If bears push the $0.255 level today, XRP may return to the support of $0.250.
XRP is trading at $0.2576 at press time.
XLM/USD
The price of Stellar hasn't changed since yesterday. Yet, XLM is up 17.34 percent over the past seven days.
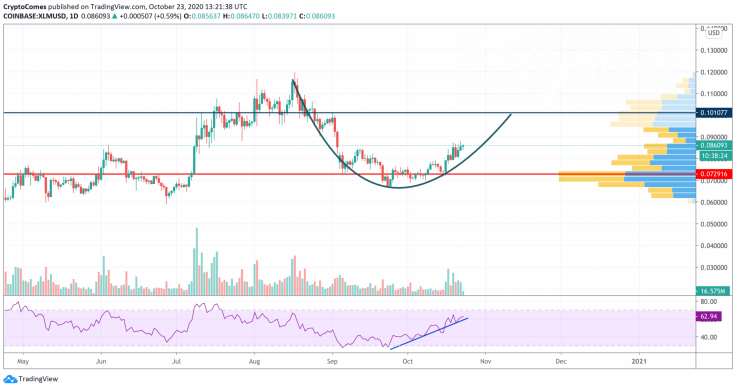
On the daily chart, Stellar (XLM) keeps rising after a successful bounce off the support of $0.07. However, the liquidity is low, which means that the bulls may find it difficult to update the peaks reached in August.
On the other hand, the bullish divergence on the RSI indicator supports the ongoing growth. In this case, the local resistance of $0.10 appears to be a major roadblock to the current rally.
Stellar is trading at $0.0859 at press time.


