By the end of the week, the cryptocurrency market has come back to the bullish zone as almost all Top 10 coins are in the green zone. Bitcoin Cash (BCH) is the only exception to the rule, and its rate has declined by 0.62%.
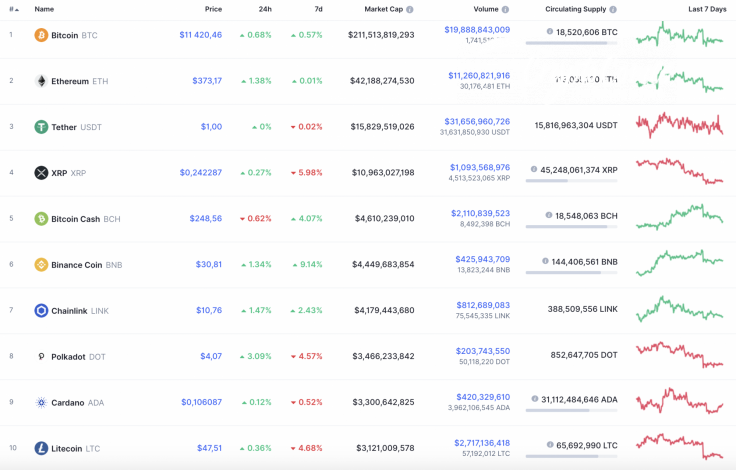
The key statistics for Bitcoin (BTC), Ethereum (ETH) and XRP today:
|
Name |
Ticker |
Market Cap |
Price |
Volume (24h) |
Change (24h) |
|
Bitcoin |
BTC |
$211,513,819,293 | $11,420.46 | $19,888,843,009 | 0.68% |
|
Ethereum |
ETH |
$42,188,274,530 | $373.17 | $11,260,821,916 | 1.38% |
|
XRP |
XRP |
$10,963,027,198 | $0.242287 | $1,093,568,976 | 0.27% |
BTC/USD
The price of Bitcoin (BTC) is unchanged for the weekend, which means that traders are accumulating power for a price blast. The leading crypto has risen by just 0.68% since yesterday.

On the daily chart, Bitcoin (BTC) has been trading in the range of $11,300-$11,700 for the last seven days. This means that, next, there is a high chance of seeing a sharp move either up or down.
From the technical point of view, the rise is more possible than the drop. However, as part of the correction from the drop, bulls are still weak from updating the previous peaks. In this regard, a false breakout of $11,950 may occur soon.
Bitcoin is trading at $11,440 at press time.
ETH/USD
Ethereum (ETH) has been more volatile than Bitcoin (BTC). The price of the chief altcoin has risen by 1.38% over the last 24 hours.
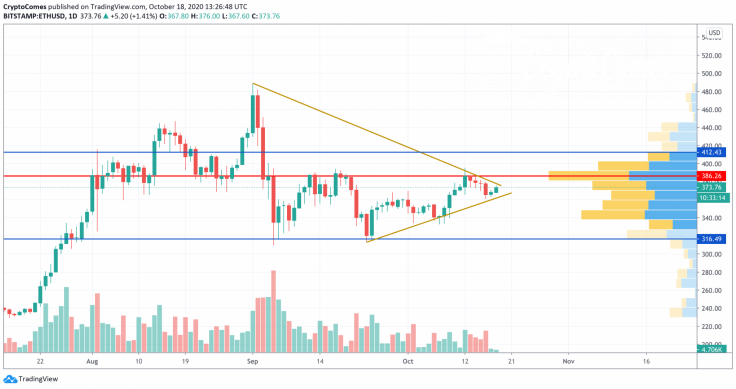
Ethereum (ETH) is located in the triangle pattern on the daily chart. The volatility is going down, which means that next week one may see a price rise. Even though liquidity is high, the trading volume is not enough to set new highs. That is why the more likely scenario is a retest of the resistance at $400, followed by a decline.
Ethereum is trading at $373.67 at press time.
XRP/USD
XRP gained the least from the list today. The price of the coin has increased by only 0.27% since yesterday.
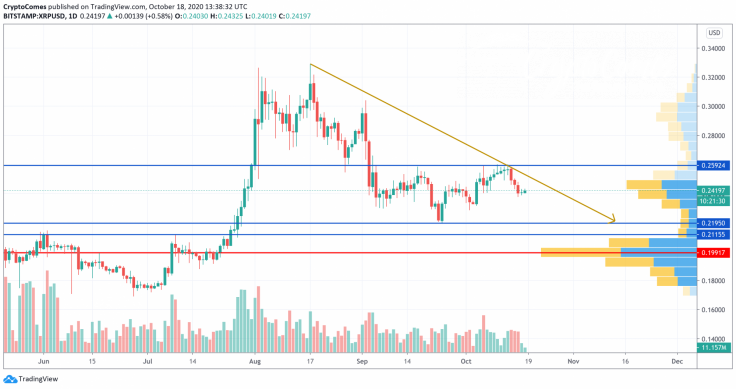
XRP seems like it is not going to follow Bitcoin (BTC) or Ethereum (ETH). On the daily chart, the crypto has made a false breakout of the $0.2592 zone. Moreover, there is no liquidity above, which makes the position of bears stronger. In addition, the falling channel has not been broken thus far. All in all, if the trading volume remains in the same place, a retest of the support of $0.22 may occur soon.
XRP is trading at $0.2421 at press time.


