The new week has started on the back of the ongoing bullish momentum, with all the top 10 cryptocurrencies being in the green zone.
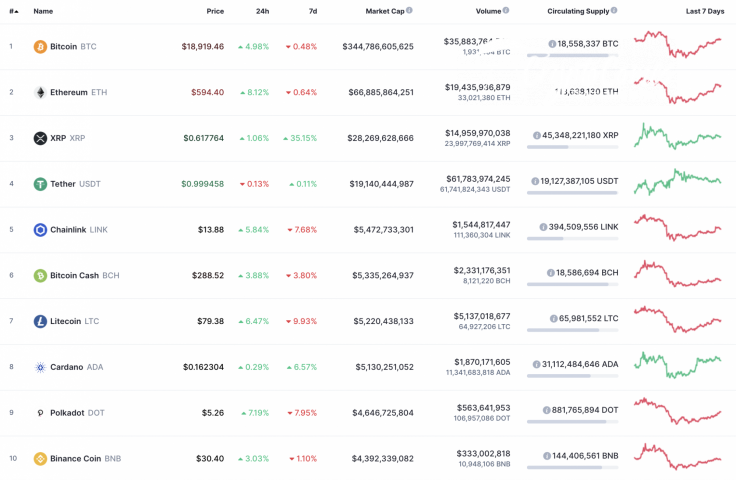
The main data for Bitcoin (BTC), Ethereum (ETH), and XRP:
|
Name |
Ticker |
Market Cap |
Price |
Volume (24h) |
Change (24h) |
|
Bitcoin |
BTC |
$344,786,605,625 | $18,908.26 | $35,883,764,546 | 5.19% |
|
Ethereum |
ETH |
$66,885,864,251 | $593.86 | $19,435,936,879 | 8.10% |
|
XRP |
XRP |
$28,269,628,666 | $0.618271 | $14,959,970,038 | 1.21% |
BTC/USD
Trading volumes were below average on Saturday, but buyers managed to find support at $17,000 and bounced back above the hourly EMA55.
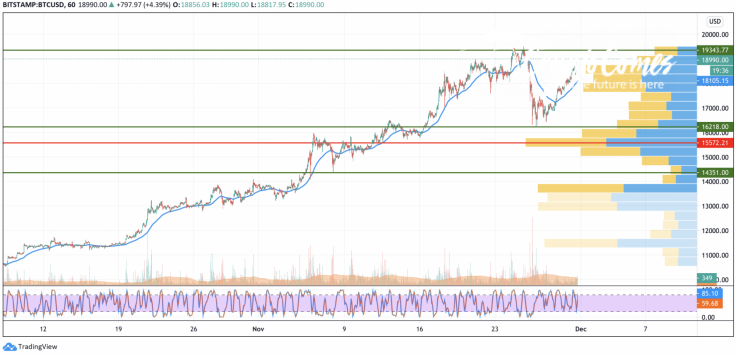
Before the end of the day, the pair had consolidated in the support area of $17,600, and the recovery had continued until the bulls tested the $18,200 level. Until the end of last week, trading activity hadn't decreased, and the price had consolidated in a narrow sideways range with support at $18,000.
Judging by the Stoch RSI indicator on the weekly timeframe, the bulls will not be able to remain in the overbought zone for a long time, and even such еру 78.6% Fibonacci retracement level will not be able to stop the bears' onslaught. In this case, support should be sought in the area of the daily EMA55, which is the $15,200 level.
Bitcoin is trading at $19,207 at press time.
ETH/USD
Last weekend, the bearish pressure on the market was barely palpable. With medium-size volumes, the buyers managed to break above the resistance of $550 and tested the level of $580 at the beginning of this week.
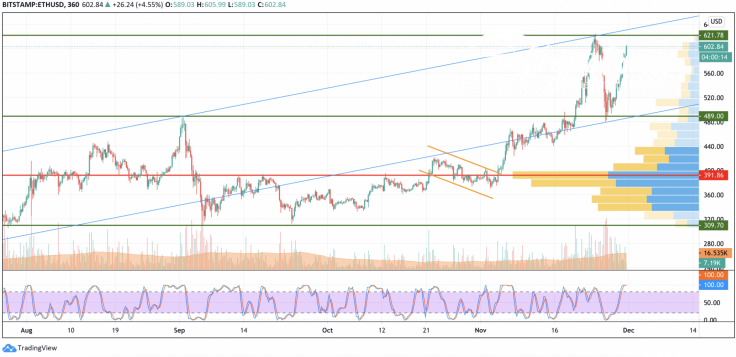
Today, this weak support level could prop up the continued recovery towards the $600 area. With support from large buyers, the bulls could update their yearly high in the $640 area this week. If the bears get in the driver's seat, they may not allow a breakout into the zone of the annual high and renewed selling pressure will push the price into the area of $440.
Ethereum is trading at $601.98 at press time.
XRP/USD
Last Saturday, the XRP price consolidated around the hourly EMA55. In the afternoon, there was a small spike in volume, which led to a break above the $0.60 mark.
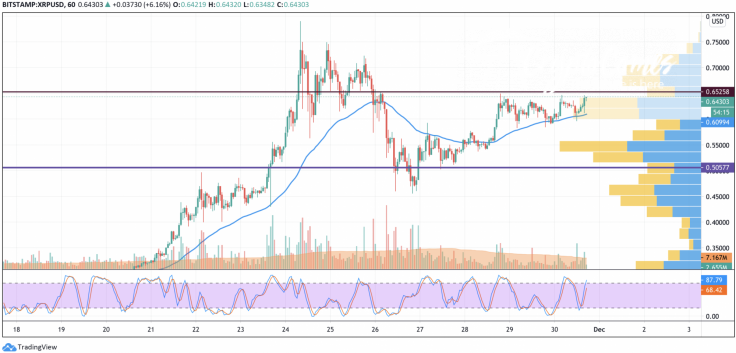
If the bulls intensify the onslaught, then the growth may continue to the area of the $0.70 mark. If the bearish momentum picks up steam, then it will be enough to break the support and make the pair return to the psychological level of $0.50.
XRP is trading at $0.6399 at press time.


