The situation is unchanged since yesterday as the main cryptocurrencies remain in the green zone. XRP is the top gainer today, rising by almost 10%.
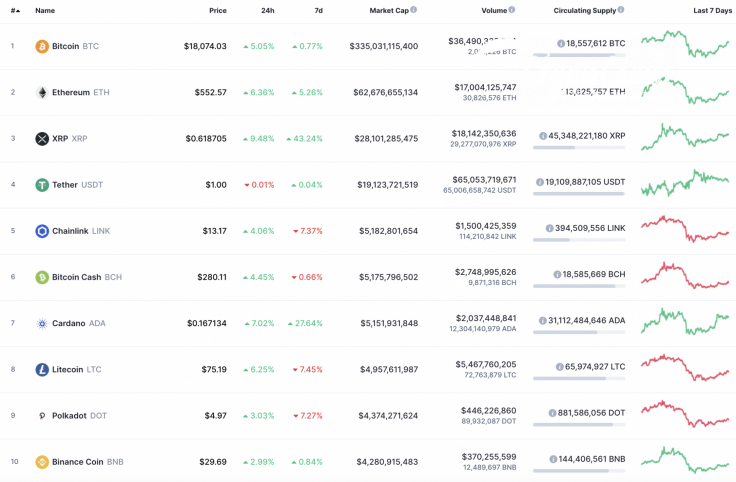
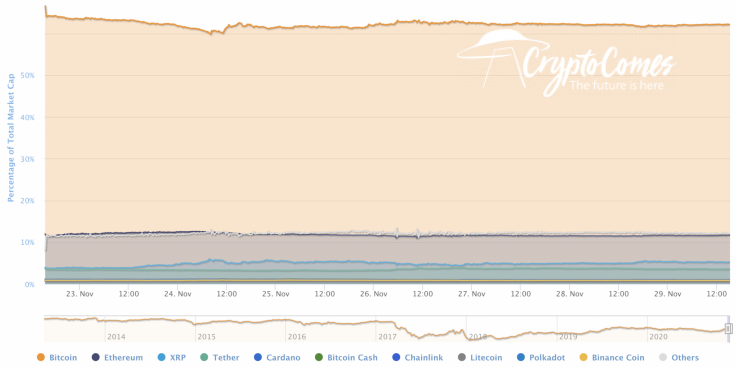
While Bitcoin (BTC) keeps trading sideways, altcoins are showing their power, reflecting the dominance rate of the main crypto. At the moment, its value is 62.1%.
The relevant data of Bitcoin is looking the following way:
-
Name: Bitcoin
-
Ticker: BTC
-
Market Cap: $335,175,165,318
-
Price: $18,047.34
-
Volume (24h): $36,159,773,818
-
Change (24h): 4.89%
The data is relevant at press time.
BTC/USD: Trading sideways before a move to $20,000
The rate of the main crypto has remained the same since the beginning of the passing week. The price change has accounted for only +0.02%.
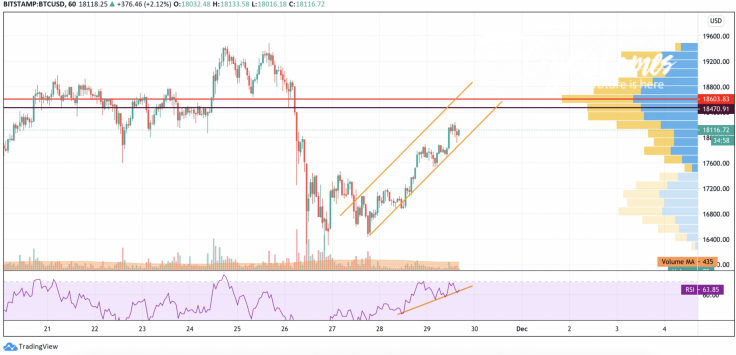
On the hourly chart, Bitcoin (BTC) has been trading in a rising channel since yesterday against a relatively low trading volume. The value of the RSI indicator is about to get to the overbought zone, which means that there are low chances of breaking the nearest resistance level at $18,470.
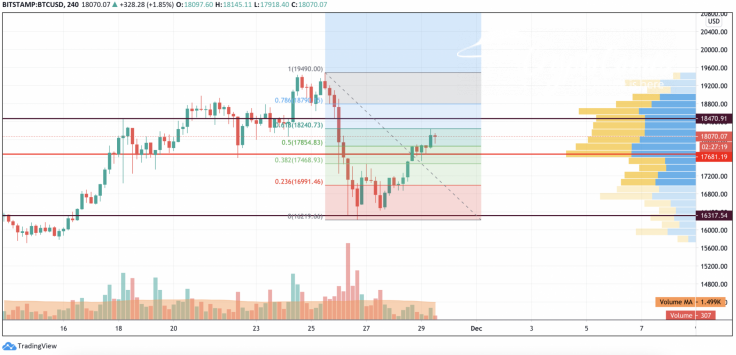
On the bigger time frame, the situation is similar, signaling a possible short-term decline. Thus, there is almost no liquidity above $18,800, confirming that it is too early to consider setting new peaks from the current levels.
All in all, if Bitcoin (BTC) cannot fix above $18,500 shortly, there is a high probability of a correction to the 23.6% level of the Fibonacci retracement ($16,990).

On the daily chart, Bitcoin (BTC) is still in the accumulation phase. The liquidity is low, which means that buyers have not gathered enough strength for a continued rise at the moment. Thus, the trading volume is low. To sum up, trading in the area of $16,300-$18,500 remains the more likely scenario for the upcoming weeks.
Bitcoin is trading at $18,063 at press time.


