Bullish sentiment might have made a comeback in the cryptocurrency market, with almost all of the 10 coins being in the green zone. Binance Coin (BNB) is the only exception after suffering a 0.01 percent dip.
The key data for Bitcoin (BTC), Ethereum (ETH), and XRP:
|
Name |
Ticker |
Market Cap |
Price |
Volume (24h) |
Change (24h) |
|
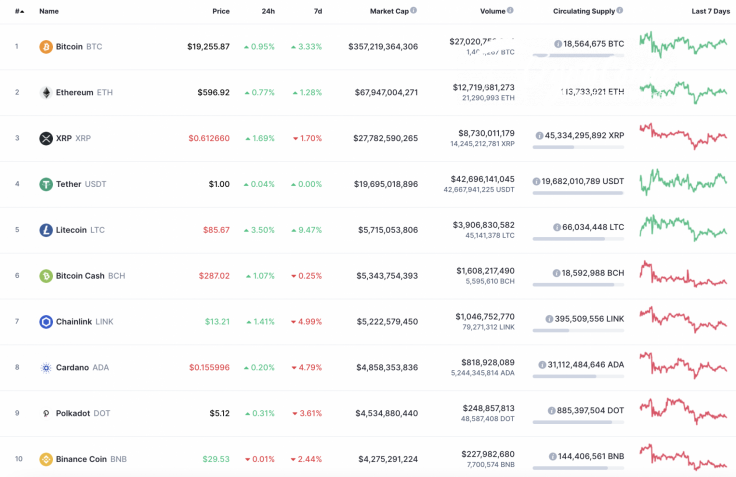
Bitcoin |
BTC |
$357,219,364,306 | $19,244.52 | $27,020,753,044 | +0.93% |
|
Ethereum |
ETH |
$67,806,686,145 | $596.19 | $11,978,373,242 | +0.78% |
|
XRP |
XRP |
$27,679,010,298 | $0.611394 | $8,722,574,484 | +1.97% |
BTC/USD
Last weekend, trading activity was low, but even with small buying volumes, the bulls were able to gain a foothold above the hourly EMA55. Sellers tried several times to push the pair below the average level, but until the end of the week, the price remained in a sideways corridor above the EMA55 moving average.
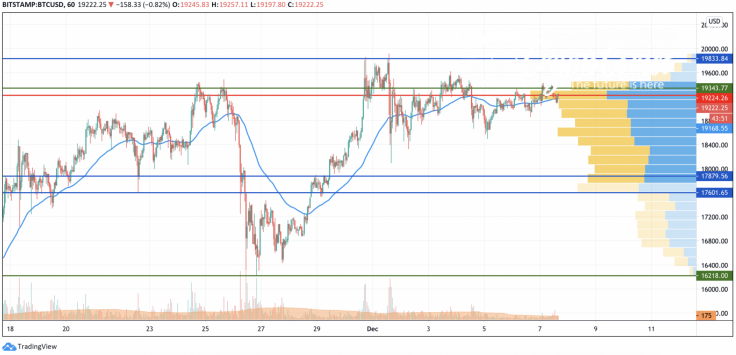
There has been no strong pressure from the bears this morning. If the average price level once again works as support, then the bulls will try to continue their attempts to storm the 100 percent Fibonacci retracement level ($19,666).
Bitcoin is trading at $19,225 at press time.
ETH/USD
Last Saturday, sales volumes decreased, and the ETH/USD pair recovered to the average price area. Until the end of last week, the price of Ethereum (ETH) had been moving sideways around the hourly EMA55. Buyers tried to hold above the $600 mark, but by the beginning of this week, they failed to gain a foothold above this strategic line.
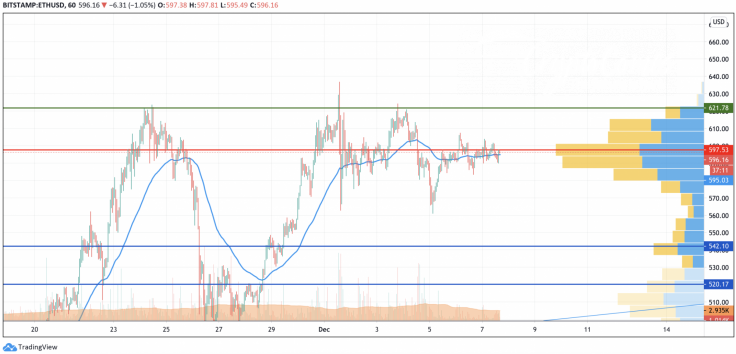
If bearish pressure intensifies, there is a possibility of a renewed decline due to weak support in the areas of $560 and $540. A stronger support level can be considered the upward green trend line, which runs around the $520 mark.
Ethereum is trading at $596.23 at press time.
XRP/USD
Over the weekend, the XRP price recovered to the mid-range, but the POC line ($0.619) prevented more upside. The range of consolidation narrowed significantly tonight.
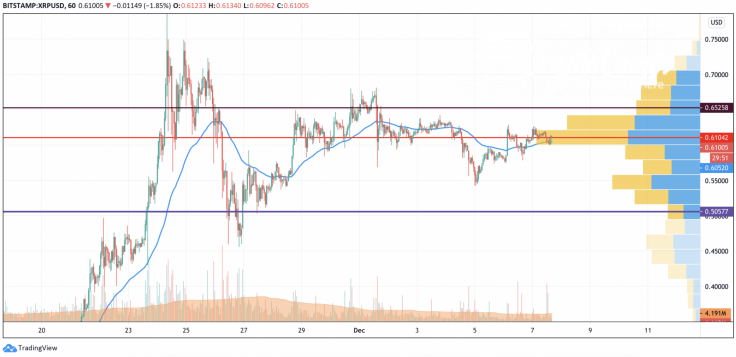
If buyers are able to overcome the resistance level of the Volume Profile indicator line ($0.619), then the growth will resume to the level of $0.70. In case the bears intensify the pressure and push through the support of the hourly EMA55, then the price may test the psychological level of $0.50.
XRP is trading at $0.6107 at press time.


